

Dashboard and Chart in Dynamics CRM 2011 – Part 1
Vincent Zhong, 20 February 2012
Recently I was given a task to assist a client with Dashboard and Chart issues, and provided a quick demo. I have learnt that the best way to learn is to teach! After my preparation and demo, I have great insight on how flexible and powerful Charts and Dashboards are, and how they can help a business get smarter and stronger.
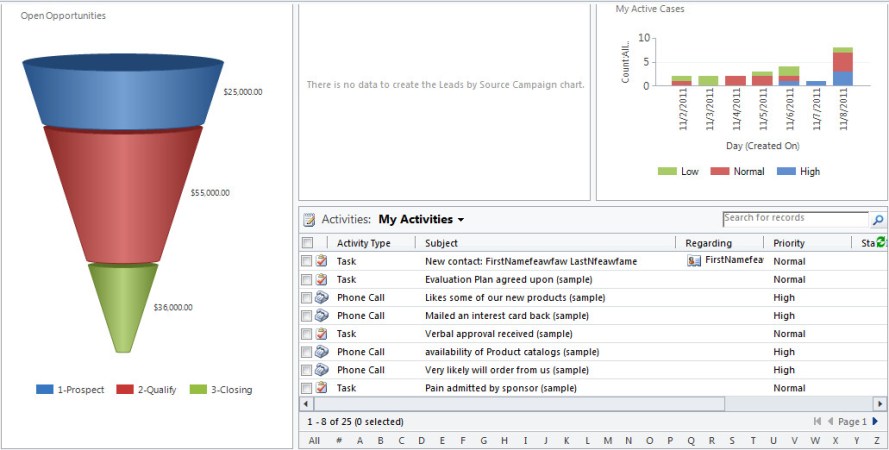
There are two types of Dashboard and Chart: System and Personal. They are designed for different types of users, and the way to create them also differs.
Below is a chart showing some of the differences between them.
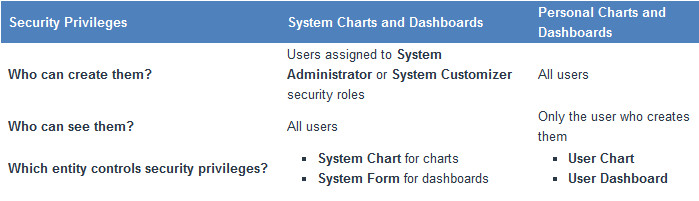
As you can see, only users who have System Administrator or System Customizer security roles can create System Charts and Dashboards, and once they have been created, all users can see them. On the other hand, all users can create their own Charts and Dashboard, but only that user can view them.
This is how to create them:
For System Charts and Dashboards, first you need to go to the customization area of your CRM, by going to “Settings -> Customizations”,
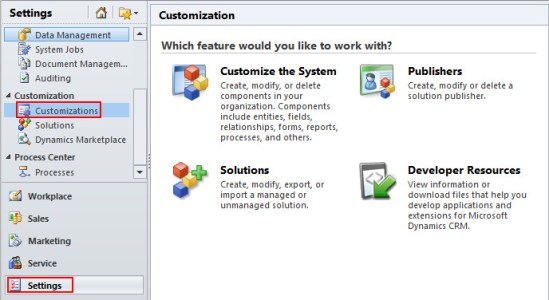
You will see a pop up window like this:
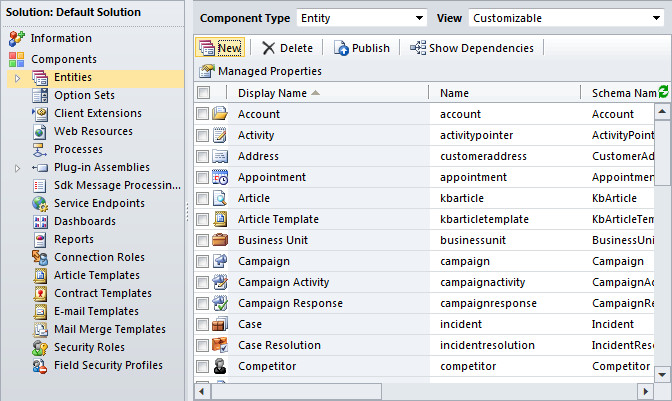
If you want to create a System Chart for an entity, expend the Entities list, by clicking the triangle on the left, and then expend the Entity you want to create a new System Chart, by clicking the triangle again, you will see the following screen:
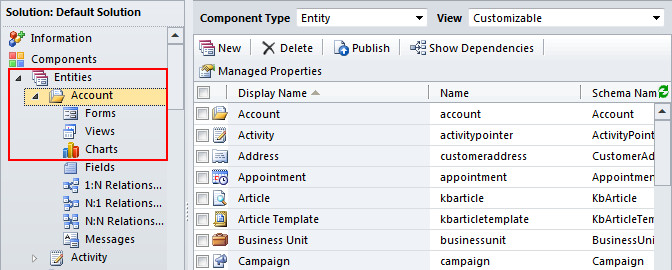
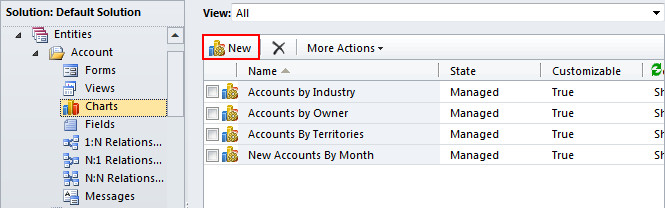
Click the “Charts” link, you will see a list of System Charts for that entity, and you can click “New” to create your own one.
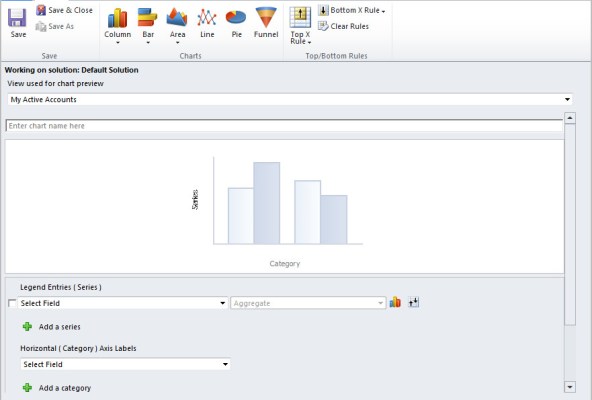
Here is New System Chart screen:
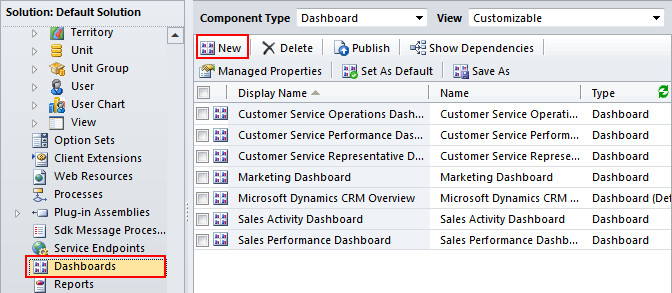
Pretty similar to System Charts, if you want to create a System Dashboard, click “Dashboards” in the main customization page, then click “New” to create your own System Dashboard.

Then click “New” to create your own System Dashboard:
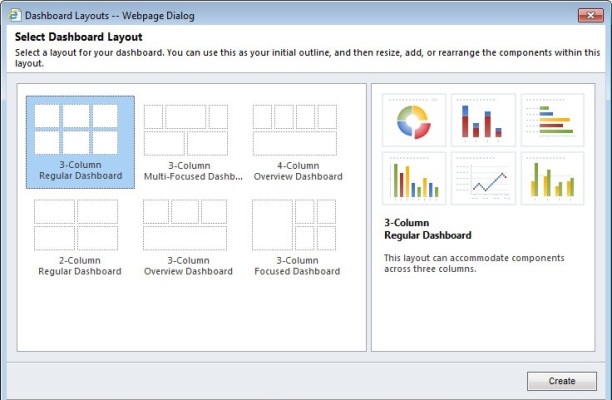
Here is the New System Dashboard screen:
Now you know how to create System Charts and Dashboards, in my next post I will show you how to create Personal Charts and Dashboards, and how to add Charts into Dashboard.
Category List

Filter by Author
Adam Murchison
Alfwyn Jordan
Arthur Mandisodza
Calum Jacobs
Colin Maitland
David Mochrie
Dominic Liu
Gayan Perera
Harshani Perera
Isaac Stephens
Jaime Smith
Jared Johnson
John Barrencechea
John Eccles
Lauren Withers
Paul Nieuwelaar
Roshan Mehta
Roz Millar
Ryan Blaikie
Ryan Ingram
Sarah Coleman
Sean Roque
Shalane Williams