
CodeMap in Visual Studio 2013
Roshan Mehta, 30 June 2013
As a developer, you would have encountered the situation where a colleague has passed on a project to you and you know absolutely nothing about the code base. The code is difficult to read and you have tried multiple times to step through the code with the debugger, but you’re having no luck. Thankfully, Microsoft has made it easier to understand the execution flow of an unfamiliar application through a new feature called CodeMap.
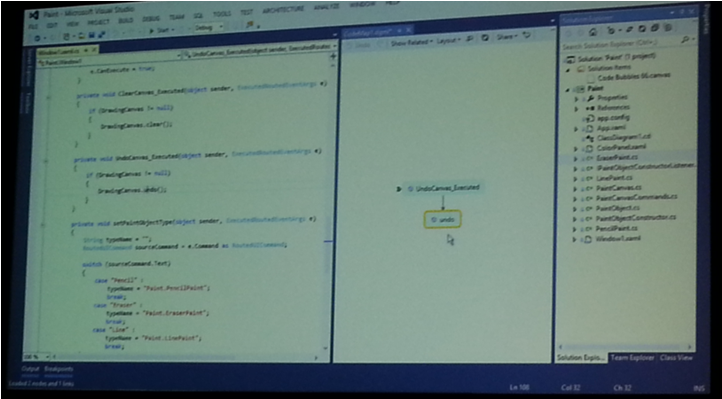
CodeMap dynamically generates a diagram which describes the relationships between methods and variables within your code. An option is available to start generating the CodeMap once you right-click on a method definition. You can then double-click on the methods presented in the CodeMap to navigate to the calling method. To understand how two methods are related, simply hover over the arrow in the relationship.
.png "CodeMap in Visual Studio 2013 (1)")
As mentioned above, CodeMap also works on variables. You can right-click on a variable and select Find All References which will automatically add it to the CodeMap. You can also flag items on the CodeMap and add notes/comments to indicate the importance of certain methods or variables. This is useful when conducting code reviews with other members in your development team. CodeMaps can also be saved for future reference.
.png "CodeMap in Visual Studio 2013 (2)")
CodeMap is also available in debug mode by clicking on the Code Map button on the toolbar. The CodeMap is automatically updated as you step into methods with the debugger. This can be used in conjunction with the callstack to understand exactly what is going on.
.png "CodeMap in Visual Studio 2013 (3)")
The same CodeMap is available for use until you clear it. If you stop and restart the debugger, the same CodeMap will be displayed.
I look forward to upgrading to Visual Studio 2013 to make use of this new feature as I believe it will greatly improve productivity when working with unfamiliar solutions.
Category List

Filter by Author
Adam Murchison
Alfwyn Jordan
Arthur Mandisodza
Calum Jacobs
Colin Maitland
David Mochrie
Dominic Liu
Gayan Perera
Harshani Perera
Isaac Stephens
Jaime Smith
Jared Johnson
John Barrencechea
John Eccles
Lauren Withers
Paul Nieuwelaar
Roshan Mehta
Roz Millar
Ryan Blaikie
Ryan Ingram
Sarah Coleman
Sean Roque
Shalane Williams