How to Create Custom Test Execution Reports in Excel from Team Foundation Server - Part 1
Miguel Nepomuceno, 25 September 2017
Team Foundation Server (TFS) is a Microsoft product which provides source code management, project management, reporting, release management and testing. TFS has a lot of inbuilt reporting and dashboard services available. By connecting TFS to Microsoft Excel, we can use different functionalities of Excel to extend reporting capabilities and be more flexible with creating test execution reports. It is also excellent for users that are more comfortable and familiar with Excel.
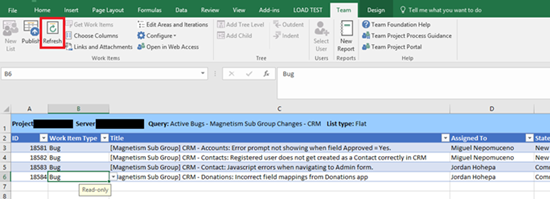
The first step to this is setting up queries in TFS. Queries are the basic building blocks for managing work items. For testers generating custom test execution reports, we would be more concerned with TFS Bugs. Queries allow us to filter work items in TFS to be transported to Excel for data sorting, visualization, etc. It is also easier to update queries when work items also change. For example, a bug changes its state depending on the test lifecycle. This could mean that the bug gets removed from an Active Bugs query and gets added to a Closed Bugs query. Queries can simply be refreshed in TFS, which gets updated dynamically in our Excel spreadsheet when clicking the Refresh button under the TEAM tab.
How a user would log and label bugs (using TFS field Title) and group these bugs (using TFS fields e.g. Tag, State, Severity, Assigned To) would determine how bugs are sorted into different queries configured by the user. In this example below, I’ve grouped all my Active Bugs in TFS via the State.
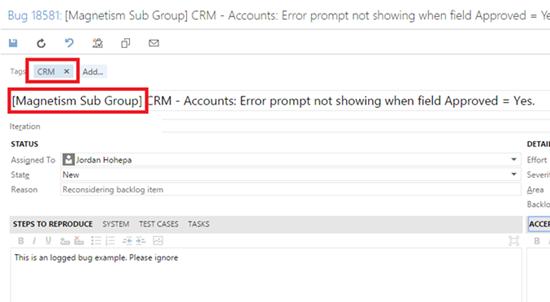
The bugs that are logged for this subcomponent in a TFS Team Project must obviously contain these filter criteria to appear under the query. This is entirely up to how the user would set up the query. Below is an example on how I labelled the bug in TFS such that it meets the conditions of the example query. This is done by including a Tag called ‘CRM’ and prefixing the Work Item Title with ‘[Magnetism Sub Group]’.
You can be creative in what Work Item fields you are using to differentiate different queries. This added flexibility in TFS allows the user to further modularise different queries. Once I run the example query, this work item gets brought under the query results.
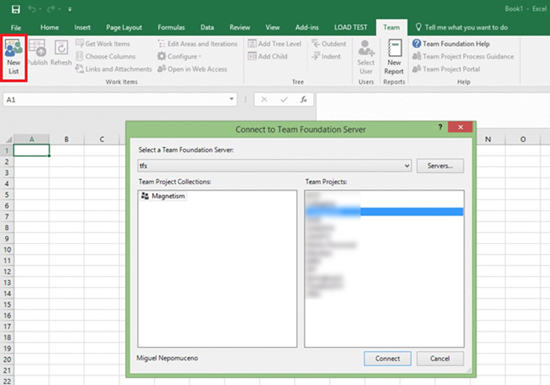
Once we can effectively separate and group each different bug accordingly in TFS, we need to establish a connection between the source TFS to the destination Excel spreadsheet. The TEAM tab in Excel allows us to connect TFS with Excel such that we can create a custom report in Excel. This automatically shows up when Team Explorer or Visual Studio is installed. If it does not show up, the TEAM tab needs to be enabled using the following steps:
- Go to File > Options to open Excel Options.
- Navigate to the Customize Ribbon.
- Click the TEAM checkbox. Click OK.
Once the TEAM tab is enabled in Excel, we can connect to a Team Project such that we can transport work item lists into Excel. Excel gives an option of creating two types of work item lists: query or input flat lists.
Using our earlier example query “Active Bugs – Magnetism Sub Group Changes – CRM” and its work item components, it gets transmitted to Excel once we choose the query list. This is shown below. Note that the Refresh button highlighted gets activated once we have connected through our query list and loaded our work components.
All done! Part 2 of this blog will cover how we can use Excel to pull in our data from TFS such that we can construct our test execution report and data visualisations.


