How to Quickly Capture Bugs in Azure DevOps using the Test and Feedback Tool
Harshani Perera, 06 August 2021
When testing software, recording issues and bugs is one of the time-consuming tasks. You may also need to use several tools to capture all the necessary data e.g., Excel, screen capture tools and paint.
The great thing about the Test & Feedback Tool is that you can do all these things with this one tool. It is quick and easy to set up and capture the issues and it’s also free to use.
The Test & Feedback Tool is a browser extension where you can test directly from the browser and log the bugs in Azure DevOps. It’s so easy anyone on the team including developers, designers, product managers can all log bugs and issues. In the following steps, I will show you how to use this tool to capture bugs in Azure DevOps.
Installing the Tool
The first step is to install the tool and connect it to Azure DevOps. Chrome, Firefox and Edge are supported browsers.
Step 1: Open the browser you want to install the tool in > Go to the link https://marketplace.visualstudio.com/ > Search for Test & Feedback extension > Open the tool > Click Install > Select the Browser you want to install the extension > Install and add Extension in your selected browser
You will see the following icon on your top right-hand corner of the browser.
The following link provides the steps in detail on how to do this for your chosen browser: https://docs.microsoft.com/en-us/azure/devops/test/perform-exploratory-tests?view=azure-devops&viewFallbackFrom=vsts
Connect to Azure DevOps
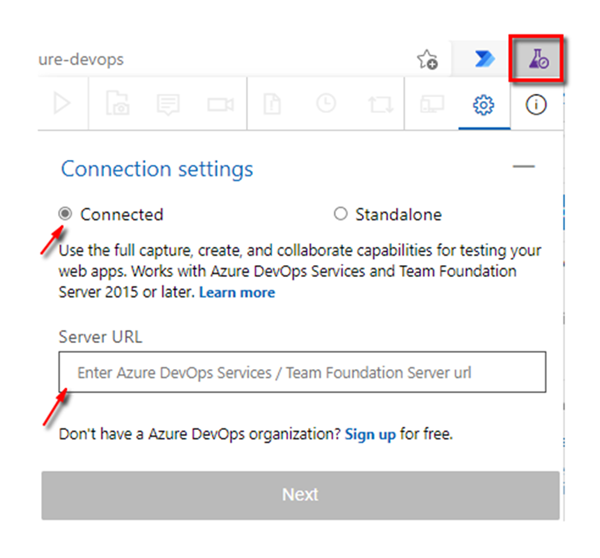
Step 2: Click the Test & Feedback Icon > Select Connected > Enter the Azure DevOps URL e.g., https://dev.azure.com/companyname > Click Next
Select you team from the list > Click Save. Now the tool will be connected to your Azure DevOps.
Start capturing
Step 3: Click the Test & Feedback icon > Click the Start button
The features will then be enabled.
Next, I will show you how to use these features that are available in the Test & Feedback Tool.
Features
· Capture screenshots
· Add notes
· Record screen
· Create bug
· View session timeline
Capture Screenshots
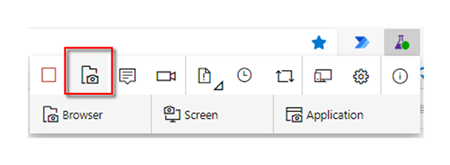
Screenshots can help to show the error messages and describe the issue more easily to the Developer. Select the ‘Capture browser tab’ button > Select either Browser, Screen or Application to screenshot.
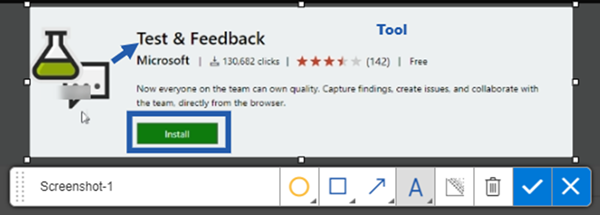
You can then add details to the image e.g., draw circle, rectangle, arrow, add text, blur, delete changes. Once it’s ready, select the tick mark.
Add Notes
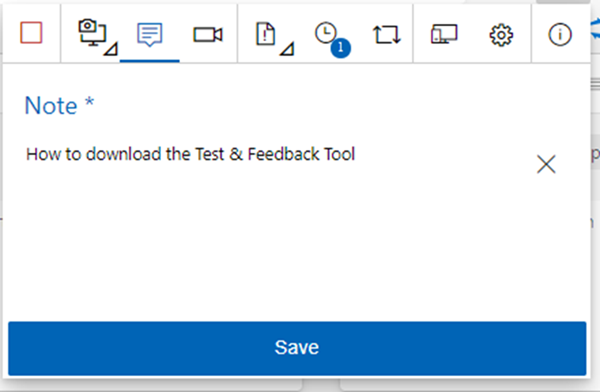
Here, you can provide any additional important information you noticed etc. Select the Add note button.
Type in any comments and click Save.
Record a Video
Instead of writing down the steps, it would be quicker to show the developer the steps you are taking through a video. It would be like a screenshare session.
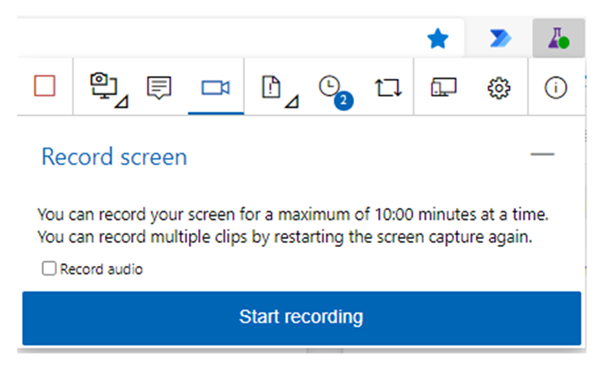
Select the Record screen button
Click Start recording > Select the Screen > Click Share
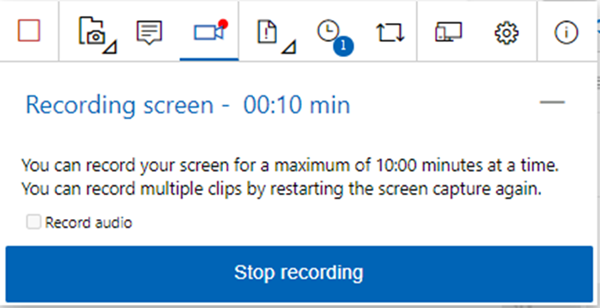
Once you have shown the steps to receive the error > Click Stop recording
View Session Timeline
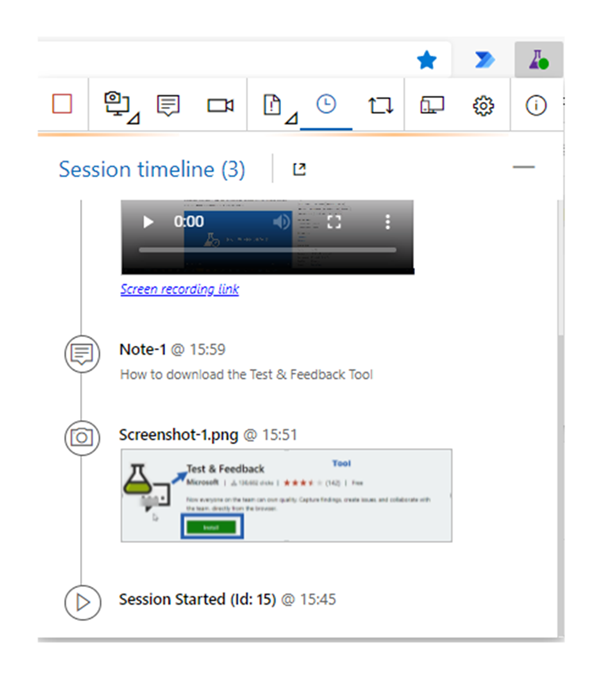
Click the timeline button
Here, you can see all the information you have captured so far.
Create a Bug in Azure DevOps
Select the Create Bug button. You can then select to either create a bug, task or test case. I will select to create a bug. Enter a bug title and click Save.
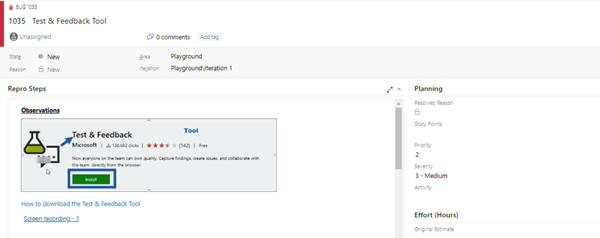
You can see the following bug has been automatically created in Azure DevOps.
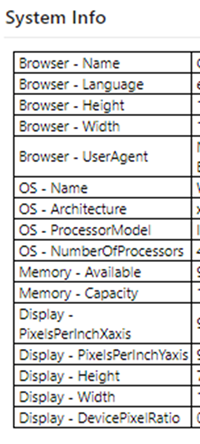
The tool will also capture the system information below on the bug.
How to view the recorded Video
Press Ctrl > Click the ‘Screen recording – 1’ link
(If it fails to open, download the VLC Media Player and set your default media player to this and try again)
Finish Capturing
Step 4: Click the stop button once you have finished the session and logged the issue in Azure DevOps. To log another issue, click the start button and follow the process above.
As you can see, Test & Feedback allows to easily capture screenshots, notes, videos, create bugs quickly with just one tool. It is accessible to anyone on the team and not just testers to capture issues to log bugs, tasks and test cases. Best of all it is free!


