How to add a Power BI report or dashboard to Dynamics 365
Colin Maitland, 18 May 2023
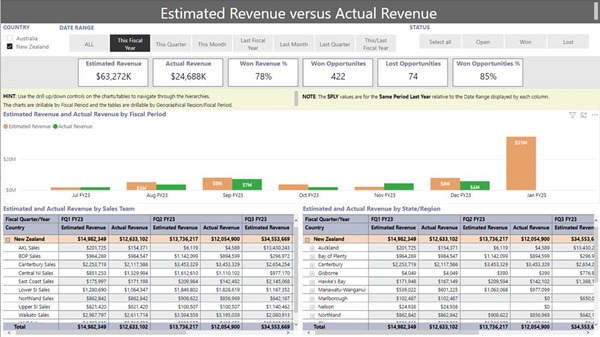
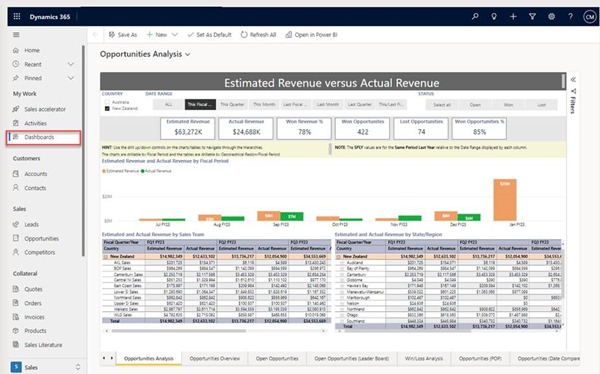
The following is the first page of a Power BI report that I want to add to a Dashboard in Dynamics 365 Model Driven app. In this article, I demonstrate how to do this. The same process can be used to add a Power BI dashboard to a Dashboard in a Dynamics 365 Model-Driven app.
The process consists of nine simple steps as follows.
Step 1 – Publish Power BI Report/Dashboard
The first step is to publish the Power BI report or add the Power BI dashboard to Power BI Online. You will need to keep the name of the Power BI Workspace and Report/Dashboard handy for the steps that follow.
Step 2 – Dynamics 365 Solution in Power Apps
The second step is to ensure that you have an existing solution or create a new solution in Power Apps for the environment that contains the Dynamics 365 app into which you want to add the Power BI report/dashboard.
You can access Power Apps by navigating to https://powerapps.com, signing in and then selecting the Environment which contains the app.
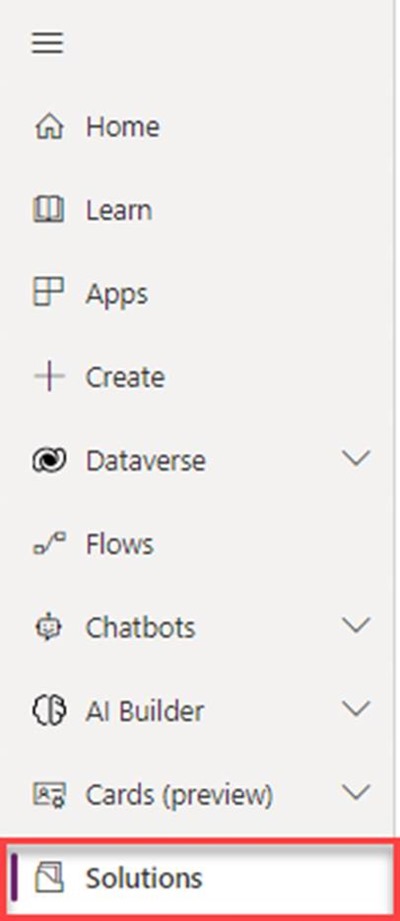
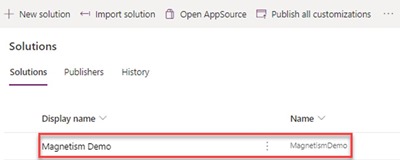
Then navigate to solutions and open an existing solution or create a new solution.
Step 3 – Create Dynamics 365 Power BI Embedded Dashboard
The third step is to add a new Power BI embedded dashboard to the solution as follows.
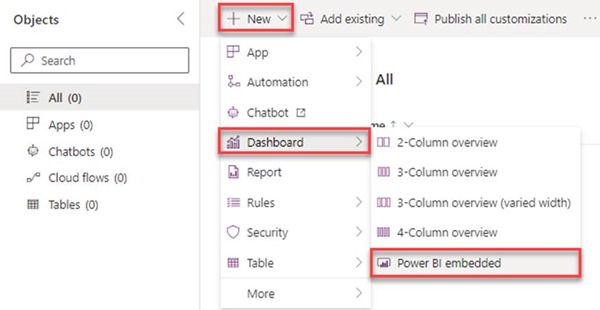
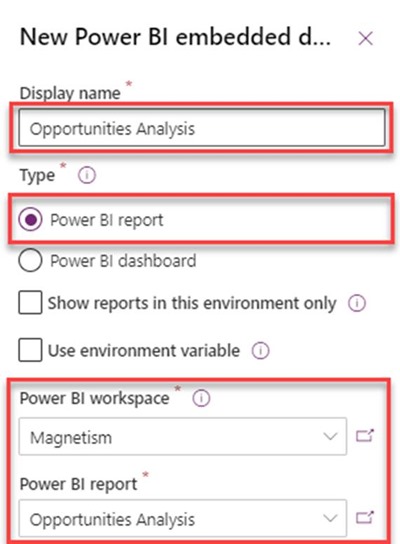
First, from the solution, click + New, and select Dashboard, Power BI embedded.
Then, enter a Display Name for the dashboard, select either Power BI report or Power BI dashboard. Optionally, unselect Show reports in this environment only, select the Power BI workspace and Power BI report or Power BI dashboard, and click Save. Note: The Power BI workspace option is not applicable if you have left the Show reports in this environment only option selected.
A new Power BI Embedded dashboard will now be created and added to the solution.
4 – Add Dynamics 365 App to the Solution
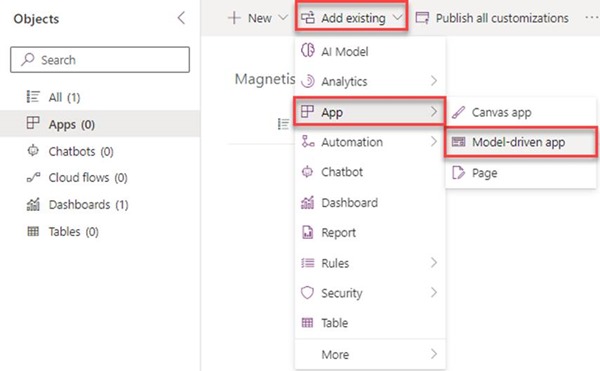
The fourth step is to ensure that the solution contains the Dynamics 365 Model-Driven app to which you want to add the Power BI Embedded dashboard. If required, you can add an existing app to the solution as follows.
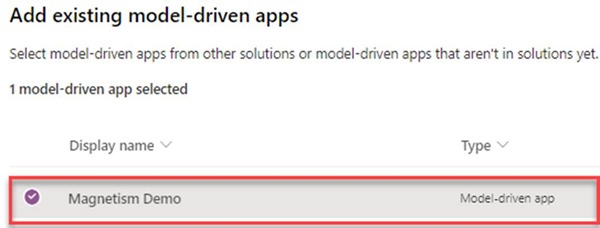
First, from the solution, click Add existing, select App, Model-driven app, select the app from the list of available apps and click Add.
The selected app will now be added to the solution.
5 – Add Power BI Embedded Dashboard to the App
The fifth step is to add the Power BI Embedded dashboard to the app as follows.
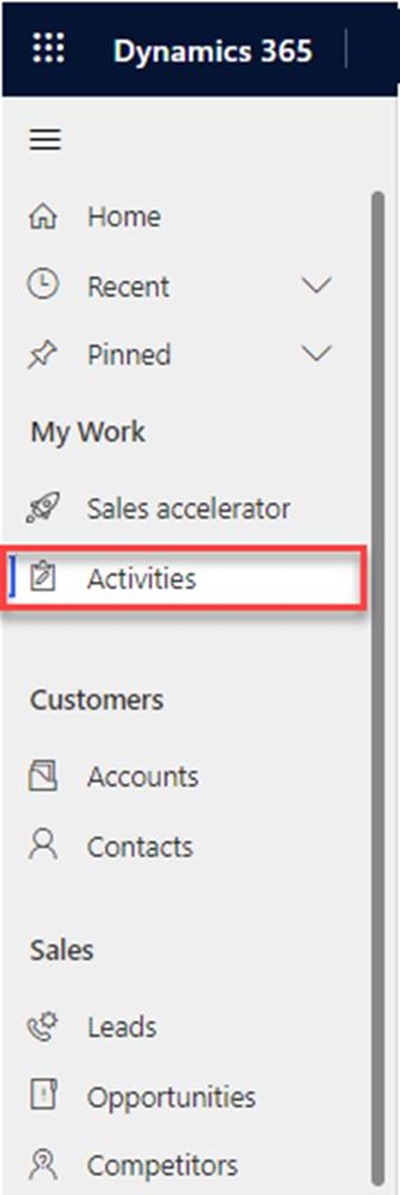
First, if the app does not include a subarea on the Site Map for accessing Dashboards, then select the area on the Site Map below which you want to add a Dashboards area and click + Add page, otherwise, just click + Add page. In this example, I want to add a Dashboards area below the Activities subarea on the Site Map. I have therefore selected Activities before clicking + Add page.
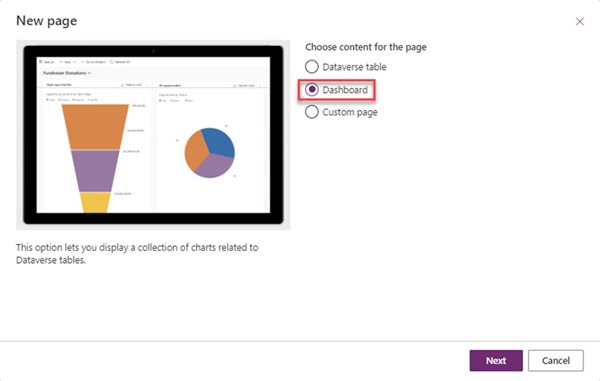
After clicking + Add page, select Dashboard on the New page dialogue, and click Next.
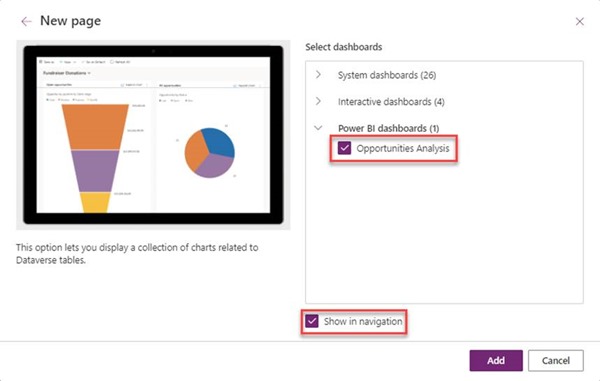
From the Select dashboards pane, collapse the System dashboards and Interactive dashboards branches, and select the dashboard from the list of Power BI dashboards.
Note: Before continuing, if the app already has a Dashboards area on the Site Map, unselect the Show in navigation option to prevent another Dashboards area from being added to the Site Map.
Click Add.
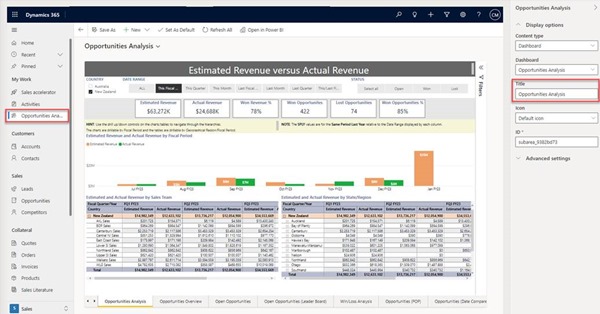
The Power BI dashboard will now be added to the app and will be accessible from the existing or newly added Dashboards area on the Site Map.
Note: If you chose to add a new Dashboards area to the Site Map by leaving the Show in navigation option selected, you need to decide whether to rename it. By default, the new Dashboards area will have the same name as the selected Power BI dashboard and that dashboard will be selected by default when accessed from this location. However, if the app has or will have multiple dashboards, you might want to rename the new Dashboards subarea to something more generic such as Dashboards.
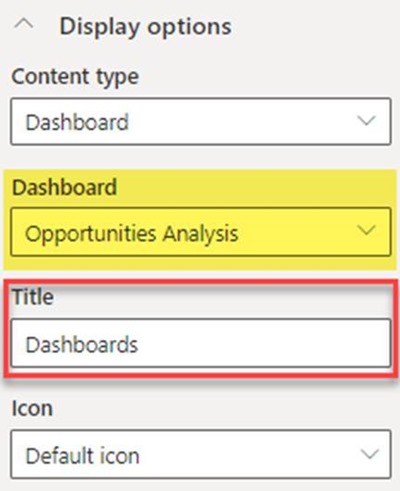
To rename the new Dashboards area, select it on the Site Map, expand the Properties pane for that area and change the Title in the Display options section to the name you want to use such as Dashboards.
Notice that in this example, even though the new Dashboards area has been renamed to Dashboards, the Dashboard that is selected by default is the Opportunities Analysis dashboard which displays the embedded Power BI Opportunities Analysis report.
The newly added Dashboards area on the Site Map is now named Dashboards. It was previously named Opportunities Analysis.
6 – Set Default Dashboard
This sixth step is to set the Default Dashboard.
If the app contains multiple dashboards, you can configure which dashboard is selected as the Default Dashboard by selecting the Dashboard and clicking Set As Default.
7 – Save and Publish
The seventh step is to save and publish the changes to the app by clicking Save and then Publish.
After you have saved and published the app, navigate back to the solution.
8 – Security Roles
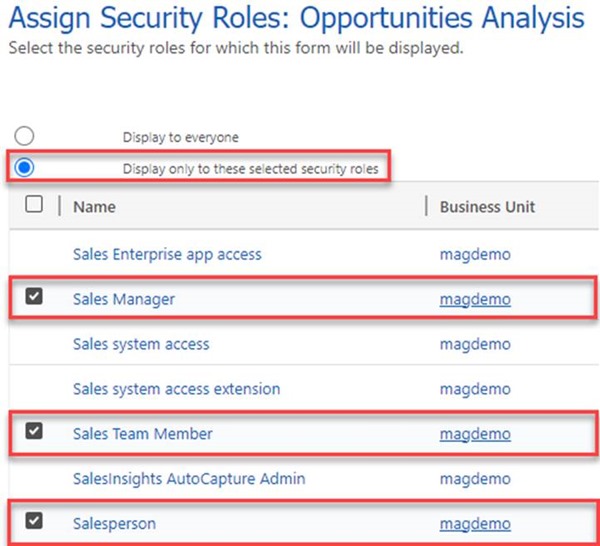
The eighth step is to optionally assign Security Roles to the dashboard to limit which users have access to it. Only those users with the same Security Roles assigned to them as those assigned to the dashboard will have access. You can assign Security Roles to the dashboard as follows.
From the solution, select Dashboards, select the Power BI Embedded dashboard and click Enable security roles.
From the Assign Security Roles dialogue, select the Display only to these selected security roles option, unselect all Security Roles, select only the Security Roles to be assigned to the dashboard and click OK.
9 – Final Steps
Test the changes you have made to the app. The best practice approach is to make changes to the app in a development environment, test it, deploy it to a testing environment, test it again, and then deploy it to your production environment.
Finally, ensure that users who require access to the Power BI report/dashboard have a Power BI licence, have access to the Power BI Workspace in which the Power BI report/dashboard is located and have access to the Dynamics 365 App.

