Power BI - P2 - Calculate Change vs Difference for two Date Ranges
Colin Maitland, 19 August 2022
This is the second part of a two-part article in which I demonstrate how to structure the Power BI data model and write measures to calculate and display the change and difference between two user selected sets of dates for a measure.
In the first article, I demonstrated the configuration of the data model and a report page. In this article I demonstrated the formulas used for the measures. These measures include additional business logic to handle blank, negative, zero and positive values.
The example used in these articles is based on the calculation of Actual Revenue for Won Opportunities.
Actual Revenue (DR1) Measure
This measure, a.k.a. Actual Revenue, calculates the Actual Revenue for the dates selected from Date using the Fiscal Periods 1 (DR1) slicer.
It is coincidental that this calculation references Date, i.e., USERELATIONSHIP(). The USERELATIONSHIP() clause in this example ensures that the calculation of the Actual Revenue is based on the Actual Close Date rather than the Created On or Estimated Close Date of each Opportunity.
It is important however that this calculation does not reference ‘Date 2’.
For the curious, Opportunities[Actual Revenue] is the Actual Revenue for a Won Opportunity, and Opportunities[Actual Revenue] is an adjustment factor that scales the Actual Revenue for the Opportunity by the number and value of its individual related Opportunity Product records.
Actual Revenue (DR2) Measure
This measure calculates the Actual Revenue for the dates selected from ‘Date 2’ using the Fiscal Periods 2 (DR2) slicer and ignoring any dates selected from ‘Date’ using the Fiscal Periods 1 (DR1) slicer.
This calculation works by invoking a modified version of the Actual Revenue measure.
This calculation works as follows …
(a) Firstly, this measure removes any Date filters that are applied to Opportunities using REMOVEFILTERS(). This has the effect of removing any dates selected using the Fiscal Periods 1 (DR1) slicer from the calculation’s evaluation context.
(b) Secondly, this measure activates the relationship from ‘Date 2’ to Date using USERELATIONSHIP(). This has the effect that ‘Date 2’ now filters Date by the dates selected using the Fiscal Periods 2 (DR2) slicer which in turn then filters Opportunities by the relationship(s) that from Date to Opportunities.
(c) Finally, this calculation then invokes the original Actual Revenue measure within the modified evaluation context, i.e., the dates that are used by the Actual Revenue calculation are now those selected using the Fiscal Periods 2 (DR2) rather than Fiscal Periods 1 (DR1) slicer.
Actual Revenue (DR1 - DR2)
This measure calculates the change in Actual Revenue between the two user selected sets of dates.
The calculation assumes that the Dates selected using Date are later than the Dates selected using ‘Date 2’.
In this calculation, if the Actual Revenue is the same for both sets of Dates, then the result will be $0 rather than blank. However, you can optionally restructure this calculation to return blank instead of 0 as follows …
Actual Revenue (DR1 - DR2) %
This measure calculates the change in Actual Revenue between the two user selected sets of dates as a percentage. Even though, for my example, it is not expected that Actual Revenue would ever be a negative value, this calculation takes each of the following scenarios into consideration …
(i) Scenario 1: if both Actual Revenue and Actual Revenue (DR2) are the same, then return blank rather than 0. This also includes when Actual Revenue and Actual Revenue (DR2) are both either blank or 0.
(ii) Scenario 2 and 3: if Actual Revenue and Actual Revenue (DR2) are not the same but one is blank or 0, then return either positive or negative 100%.
(iii) Scenario 4: otherwise, return the change from Actual Revenue (DR2) to Actual Revenue as a positive or negative percentage using the formula for calculating change as a percentage.
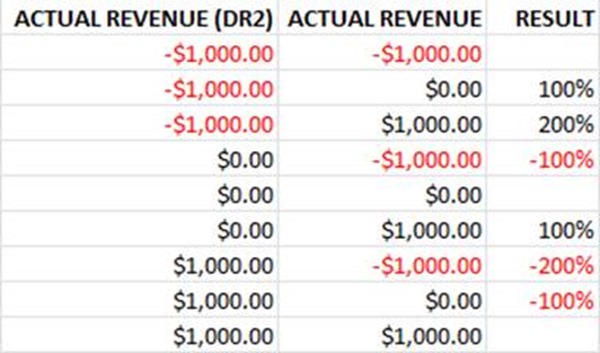
Here are the expected results for some sample combinations of Actual Revenue (DR2) and Actual Revenue. In all scenarios, the result could be blank or a positive or negative percentage. In those scenarios where one of the Actual Revenue values is 0 and the other is not, the result is 100%.
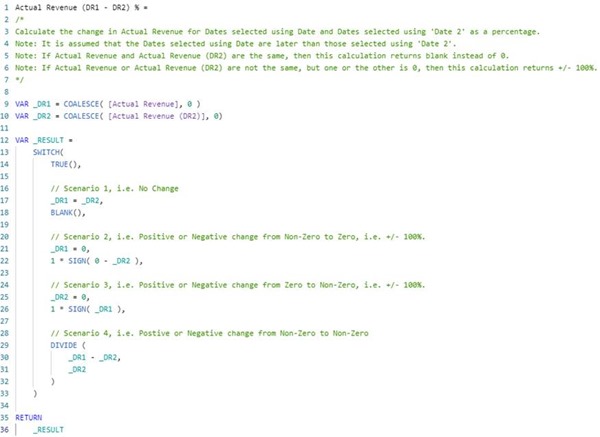
Here is the DAX formula for the measure …
In this calculation, the following logic has been used …
(a) Firstly, COALESCE() is used to convert any blank values into 0. This simplifies the structure of the business logic that follows because we now only need to check for 0 rather than blank or 0.
(b) Secondly, a SWITCH( TRUE(), … ) pattern instead of a nested IF pattern is used to simply the structure of the business logic. The calculation invokes the first branch within the SWITCH() statement that evaluates to true. The last branch is the default.
(c) Thirdly, a branch within the SWITCH() statement is used for each scenario that needs to be considered. It is important that the first branch is _DR1 = _DR2 because this includes the scenarios where both _DR1 and _DR2 are equal to 0. If this branch was not prior to the subsequent branches, the calculated results for some scenarios would be incorrect.
(d) Finally, and importantly, the Format property of the measure is set to Percentage. This ensures that a calculated result such as 1 will displayed as 100% rather than 1.
Actual Revenue (DR1 vs DR2)
This measure calculates the difference in Actual Revenue between the two selected sets of dates. This calculation is the same as that for Actual Revenue (DR1 – DR2) except that the difference is returned rather than the change. Compared with calculating change, the calculation for difference always returns either blank or a positive value rather than blank, a positive or a negative value.
Actual Revenue (DR1 vs DR2) %
This measure calculates the difference in Actual Revenue between the two selected sets of dates as a percentage. Even though, for my example, it is not expected that Actual Revenue would ever be a negative value, this calculation takes each of the following scenarios into consideration …
(i) Scenario 1: if both Actual Revenue and Actual Revenue (DR2) are the same, then return blank rather than 0. This also includes when Actual Revenue and Actual Revenue (DR2) are both either blank or 0.
(ii) Scenario 2: if Actual Revenue and Actual Revenue (DR2) are not the same but one is blank or 0, then return negative 200%.
(iii) Scenario 3: otherwise, return the change from Actual Revenue (DR2) to Actual Revenue as a percentage using the formula for calculating difference as a percentage.
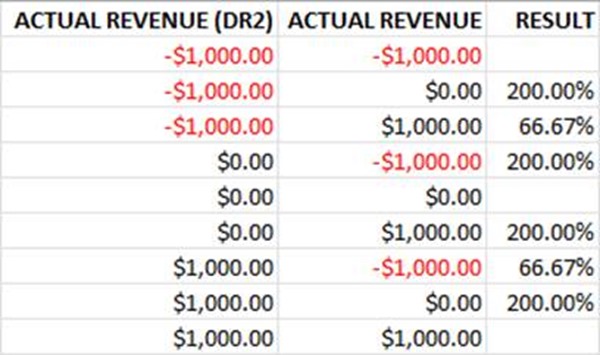
Here are the expected results for some sample combinations of Actual Revenue (DR2) and Actual Revenue … In all scenarios, the result could be blank or a positive percentage. In those scenarios where one of the Actual Revenue values is 0 and the other is not, the result is 200%.
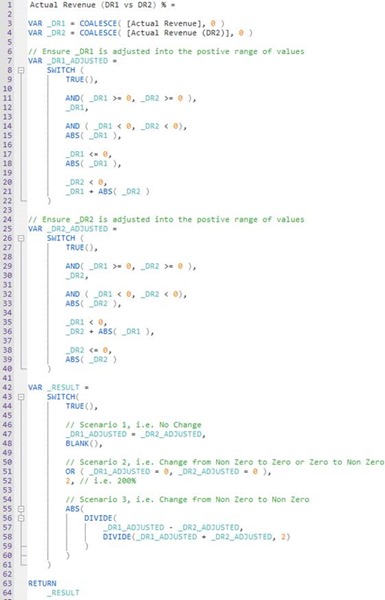
Here is the DAX formula for the measure …
In this calculation, the following logic has been used …
(a) Firstly, COALESCE() is used to convert any blank values into 0. This simplifies the structure of the business logic that follows because we now only need to check for 0 rather than blank or 0.
(b) Secondly, the Actual Revenue is proportionally adjusted and assigned to _DR1_ADJUSTED, so that the Actual Revenue and Actual Revenue (DR2) values used by the calculation are 0 or a positive value.
(c) Thirdly, the Actual Revenue (DR2) is proportionally adjusted and assigned to _DR2_ADJUSTED, so that the Actual Revenue and Actual Revenue (DR2) values used by the calculation are 0 or a positive value.
(d) Fourthly, a SWITCH( TRUE(), … ) pattern instead of a nested IF pattern is used to simply the structure of the business logic. The calculation invokes the first branch within the SWITCH() statement that evaluates to true. The last branch is the default.
(e) Fifthly, a branch within the SWITCH() statement is used for each scenario that needs to be considered. It is important that the first branch is _DR1 = _DR2 because this includes the scenario where both _DR1_ADJUSTED and _DR2_ADJUSTED are equal to 0. If this branch was not prior to the subsequent branches, the calculated results for some scenarios would be incorrect.
(f) Finally, and importantly, the Format property of the measure is set to Percentage. This ensures that a calculated result such as 2 will displayed as 200% rather than 2.
Conclusion
In conclusion, the pattern demonstrated in these two articles is an elegant pattern that can be used when you want to configure a report and related measures to calculate and display the change and difference between two user selected sets of dates for a measure. You can adjust this pattern suit your own business needs.
This pattern is simple to understand and to implement. The most difficult part is ensuring that the business logic is suitably structured to handle blanks, zeros, positive values and negative values.
The effort required is minimal given that it only requires the addition of a secondary date table which can be a copy of the primary date table, the addition of one new relationship and then the addition of one to four additional measures to calculate the actual or percentage change or difference.


