Calculate Mean, Median, Mode and Percentile for a Measure in Power BI
Colin Maitland, 22 May 2022
In this article, I will demonstrate how to calculate the Minimum, Maximum, Mean, Median, Mode and Percentile for a set of values calculated using a measure. This demonstration considers whether the rows for which the measure returns a blank result are included or excluded. I will also demonstrate the use of ALLSELECTED() with these calculations for modifying the results when displayed on a visualisation such as a matrix.
You can click any of the images in this article to enlarge them.
The data cards in this image show the results of the calculations demonstrated in this article.
In this article, I will use a calculated table named Demonstration containing a set of sample values. This image shows the creation of this table using DAX.
The following image shows the contents of this table. The values for rows 0 to 2 and 15 to 17 are blank, and the other rows contain a single occurrence of the values 0 to 9, except for the value 3 of which there are three occurrences.
A measure to count the number of rows in the table using COUNTROWS() returns a result of 18. If the table contained no rows, then the result would be blank.
A measure to calculate the sum of the values in the table using SUM() returns a result of 51. If the table contained no rows or all the values in the table were blank, then the result would be blank.
This simple measure is used in this article to demonstrate the behaviour of the MINX(), MAXX(), AVERAGEX(), MEDIANX() and PERCENTILEX.INC() functions when they are used to evaluate a set of values returned by a measure such as [Test SUM)], rather than a set of values returned from a table column such as 'Demonstration'[Value].
Calculate Minimum and Maximum using MINX() and MAXX()
This measure calculates the minimum value using MINX().
This measure calculates the maximum value using MAXX().
These measures using MINX() and MAXX() returns a result of 0 and 9 respectively. MINX() excludes the rows for which the measure returns a blank result. MAXX() returns the highest value. If the table contained no rows, or only rows with blank values, then the result would be blank.
Calculate Mean using AVERAGEX()
This measure calculates the Mean using AVERAGEX(). AVERAGEX() calculates the Arithmetic Mean for a set of values.
This measure returns a result of 4.25 which is the sum of the values, 51, divided by the number of rows for which there are non-blank values, 12.
The rows for which the measure returns a blank result are excluded from the calculation of the Mean. If they were included, the result would be 2.83. If the table contained no rows or only rows with blank values, then the result would be blank.
If you want to include the rows for which the measure returns a blank result, then you could use this version of the measure which divides the sum of values by the count of rows. This returns a result of 2.83, i.e., 51 divided by 18.
Calculate Median using MEDIANX()
This measure calculates the Median using MEDIANX().
This measure returns a result of 2.5 (being the average of the middle two values 2 + 3).
The rows for which the measure returns a blank result are included in the calculation of the Median. If they were excluded, the result would be 3.5 (being the average of the middle two values 3 + 4). This is different to the results returned when using MINX(), MAXX() and MEANX() where the rows for which the measure returns a blank result are excluded. This is an important finding.
If you want to exclude rows for which the measure returns a blank result when calculating the Mean, then you would first need to summarise the table using either SUMMARIZECOLUMNS() or SUMMARIZE().
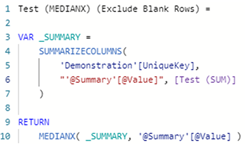
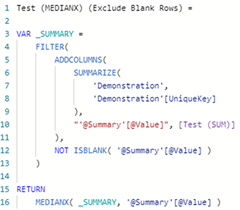
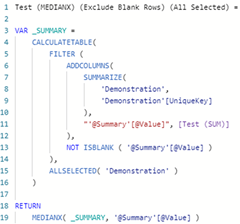
In both of the following examples, MEDIANX() is invoked against a temporary summary table assigned to the variable named _SUMMARY. The values for each row are precalculated and assigned to an additional column named '@Summary'[@Value].
Using SUMMARIZECOLUMNS() requires fewer lines to accomplish the task and provides better performance. SUMMARIZECOLUMNS() also automatically excludes rows for which the measure returns a blank result. The additional calculated column named '@Summary'[@Value] is added inside the SUMMARIZECOLUMNS() statement.
However, SUMMARIZECOLUMNS() cannot be used in visualisations that are configured to modify their external filter context. So, while this would work for a data card, or for a visualisation that is not configured to calculate the Median for multiple rows or columns, it would not work on visualisations that are configured to calculate the Median for multiple rows or columns. The following error would occur when adding the measure to the visualisation: “SummarizeColumns() and AddMissingItems() may not be used in this context”.
In that case, you could use SUMMARIZE() instead of SUMMARIZECOLUMNS().
Using SUMMARIZE() requires the use of ADDCOLUMNS() and FILTER() to achieve the same result as that achieved using SUMMARIZECOLUMNS().
The use of FILTER() is required to exclude those rows for which the measure returns a blank result because SUMMARIZE() does not automatically exclude those rows.
The additional calculated column named '@Summary'[@Value] is added outside rather than inside the SUMMARIZE() statement using ADDCOLUMNS(). This is a best practice approach when using SUMMARIZE().
The result returned by these two alternate calculations is now 3.5 because the rows for which the measure returns a blank result are now excluded from the calculation of the Median.
Calculate the Mode
There is no single function in DAX to calculate the Mode.
However, a measure using the COUNTROWS(), FILTER(), SUMMARIZE(), SWITCH() and TOPN() functions can be written to calculate the Mode. I will demonstrate this measure in a separate article.
In the context of this article, however, the calculated Mode is 3, excluding those rows for which the measure returns a blank result.
Calculate the Percentile
This measure calculates the 20th Percentile using PERCENTILEX.INC().
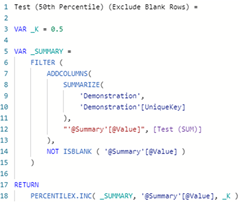
This measure calculates the 50th Percentile using PERCENTILEEX.INC()
And this measure calculates the 80th Percentile using PERCENTILEX.INC().
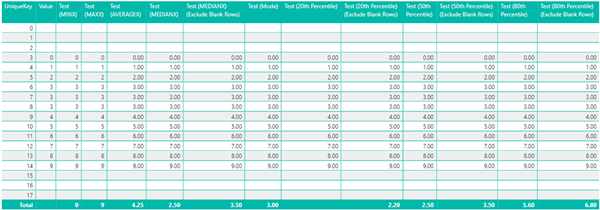
These measures return blank, 2.5 and 5.6 respectively.
Comparing the result for the 50th Percentile with the result for the Median reveals whether the rows for which the measure returns a blank result are included or excluded when calculating the Percentile. This is because the 50th Percentile should the same as the Median. This comparison shows that the calculation of the Percentile includes those rows for which the measure returns a blank result.
If you want to exclude the rows for which the measure returns a blank result, then you would first need to summarize the table using either SUMMARIZECOLUMNS() or SUMMARIZE() using the same pattern as that demonstrated when calculating the Mean. When doing so, just substitute the use of MEDIANX() with PERCENTILEX.INC() and include the parameter value for K; e.g.
The result returned by this calculation is now 3.5 because the blank rows have been excluded from the calculation of the 50th Percentile.
Using this pattern, the results returned for the 20th Percentile, 50th Percentile and 80th Percentile are now 2.2, 3.5 and 6.8 respectively.
Using ALLSELECTED()
Finally, in this article, I will demonstrate the use of ALLSELECTED() to calculate these values against all selected rows in a visualisation rather than just the current row. This is required, if for instance, you want to calculate the actual and percentage difference between the value for the current row and the Mean, Median and Mode of the values for all rows displayed by the visualisation.
This image shows the results when ALLSELECTED() is not used.
Here is an example of using ALLSELECTED() with the first version of the Median calculation demonstrated in this article. Here I have used ALLSELECTED() as a CALCULATE() modifier to modify the filters applied to any column of the 'Demonstration' table.
Here is an example of using ALLSELECTED() with the second version of the Median calculation demonstrated in this article. Here I have used ALLSELECTED() as a CALCULATETABLE() modifier to modify the filters applied to any column of the 'Demonstration' table.
When using ALLSELECTED(), you can use ALLSELECTED( 'Table Name' ) to modify the filters applied to any columns of the table, or you can use ALLSELECTED( 'TableName'[ColumnName], … ) to modify the filters applied only to specific column(s) of the table.
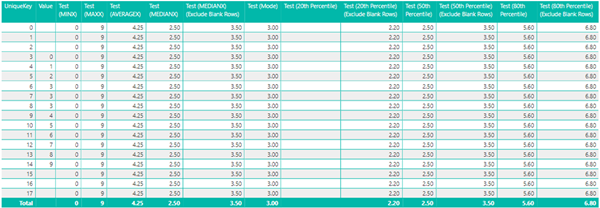
Here are the results for the calculations demonstrated in this article when ALLSELECTED() is used. Notice, that the results are also calculated for rows where the result returned by the measure, i.e., Value, are blank.
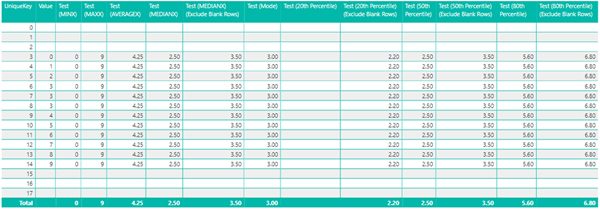
If you want to, exclude calculating these values for rows where the result returned by the measure is blank, you can include an outer IF ( NOT ISBLANK( [Test (SUM)], … ) clause around the entire calculation. Here are the results.
You can then configure the visualization, using the ‘Show Items With No Data’ property, to only display the rows for which there is data.
Conclusion
In this article, we have seen that the MINX(), MAXX(), and AVERAGEX() function exclude rows for which a measure returns a blank value when calculating the Minimum, Maximum and Mean. However, we have seen that the MEDIANX() and PERCENTILEX.INC() functions do not. However, an alternate approach can be taken using SUMMARIZECOLUMNS() or SUMMARIZE().
Finally, we have also seen that when the results are displayed in a visualisation that calculates these values for multiple rows or columns, then ALLSELECTED() may be used to obtain a result that includes all the rows displayed by the visualisation rather than just the current row.


