Power BI - Calculating Mean and Actual or Percentage difference from Mean for a Measure using DAX
Colin Maitland, 10 May 2022
In this article, I will demonstrate how to use DAX to calculate the Mean, Actual Difference from Mean and Percentage Difference from Mean for a set of values calculated by a measure in Power BI.
The Mean is the average of a set of numbers. That is, the sum of the values divided by the number of values, e.g., the Mean for { 1, 2, 2, 3, 3, 3, 4, 4, 4, 4, 5, 5, 5, 5, 5 } is 3.4375.
This demonstration is based on calculating the Won Revenue for Customers with related Won Opportunities. The following diagram shows the star schema that is used.
You can click any of the images in this article to enlarge them.
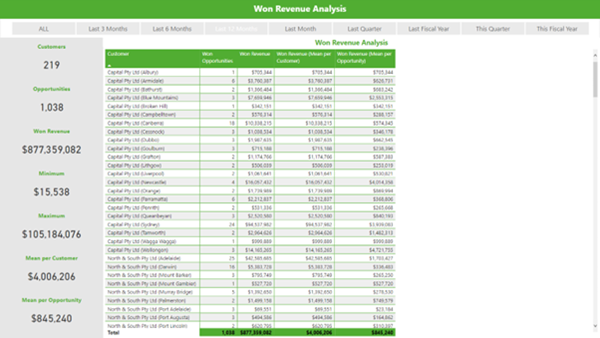
The following image shows the number of Customers with Won Opportunities, the number of Won Opportunities, Won Revenue, Minimum Won Revenue per Customer, Maximum Won Revenue per Customer, Mean Won Revenue per Opportunity, and Mean Won Revenue per Customer for a sample set of Customers and Opportunities.
This article demonstrates calculating the Mean using the DAX AVERAGEX() function. Here is an example.
The result of this calculation is 4.5. You will notice that the temporary table assigned to the variable named _TABLE contains 11 rows. However, one of those rows has a blank value. Therefore, the result calculated by AVERAGEX() is 4.50 rather than 4.09. It is important to know that AVERAGEX() excludes rows in the table being processed for which the expression returns a blank result.
Calculate Mean Won Revenue per Opportunity for Won Opportunities
The measure to calculate the Mean Won Revenue per Opportunity for Won Opportunities can be written using AVERAGEX(). In this example, AVERAGEX() calculates the Won Revenue for each Opportunity, excludes those Opportunities with no Won Revenue, and then calculates the Mean.
The result returned by this calculation is $845,240. Essentially, $877,359,082 in Won Revenue divided by 1,038 Won Opportunities.
This calculation works based on the assumption that there is only one row in the Opportunities table for each Opportunity.
Calculate Mean Won Revenue per Customer for Won Opportunities
The measure to calculate the Mean Won Revenue per Customer for those Customers with Won Opportunities can be written using AVERAGEX(). In this example, AVERAGEX() calculates the Won Revenue for each Customer, excludes those Customers with no Won Revenue, and then calculates the Mean.
The result returned by each part of this calculation is $4,006,206. Essentially, $877,359,082 in Won Revenue divided by 219 Customers with Won Opportunities.
Calculate Difference and Percent Difference
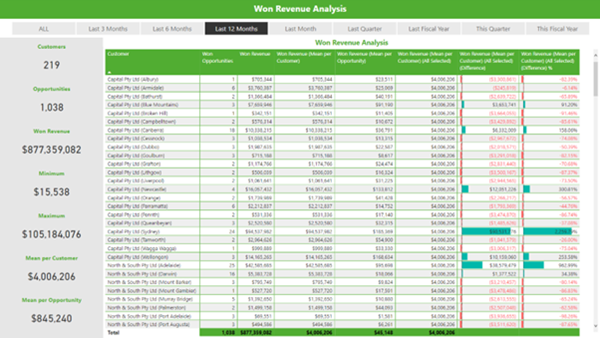
The previously calculated results can be displayed on data cards or on visualisations such as a matrix. In the following image, you will notice that the matrix displays one row per Customer with Won Opportunities. As a result, the calculated values for Won Revenue and Won Revenue (Mean per Customer) are the same. It is, therefore, not meaningful, except for this article, to display the Won Revenue (Mean per Customer) on this matrix.
However, it would be useful to calculate and display the actual difference and percentage difference between the Won Revenue for the Customer on each row compared with the Won Revenue (Mean per Customer) for the Customers on all rows of the matrix.
There are two steps to achieve this.
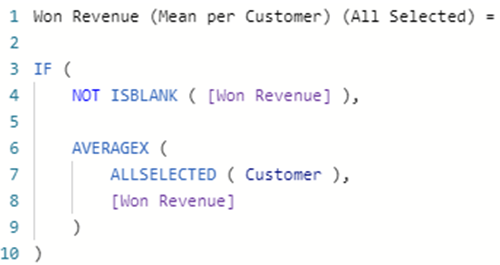
The first step is to calculate the Mean Won Revenue for all selected Customers with Won Opportunities as shown in this image.
This version of the calculation uses ALLSELECTED() as a CALCULATE() modifier to ensure that all Customers, rather than the current Customer, being iterated by the matrix are included when calculating the Mean.
The following is an alternate version of this calculation.
This version of the calculation uses ALLSELECTED() as a table modifier to ensure that all Customers selected by the AVERAGEX() function, rather than the current Customer, being iterated by the AVERAGEX() function are included when calculating the Mean.
ALLSELECTED() is a very complex DAX function to understand and must be used carefully! You can read this article for a deep dive into the internal workings of ALLSELECTED(), https://www.sqlbi.com/articles/the-definitive-guide-to-allselected.
Secondly, because of the use of ALLSELECTED(), the Mean will now be calculated for all Customers, even those without any Won Revenue. Therefore, an outer IF ( NOT ISBLANK( [Won Revenue], … ) clause has been added to ensure that the Mean is only calculated for those Customers with Won Revenue. This prevents those Customers that do not have any Won Revenue from being displayed in the matrix.
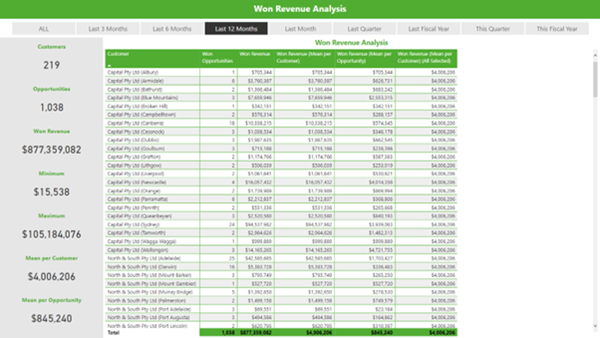
The following image shows the results of the Won Revenue (Mean per Customer) (All Selected) calculation. Notice the difference between the values calculated for Won Revenue (Mean per Customer) and Won Revenue (Mean per Customer) (All Selected). As with the Won Revenue (Mean per Customer) column, the inclusion of this column on this matrix is not useful except for the purposes of this article. However, this calculation will be used in the second step that follows.
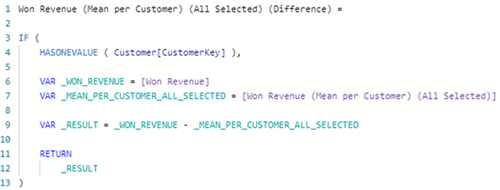
The second step is to use the previous calculation for calculating the actual difference and percentage difference between the Won Revenue for each Customer and the Mean Won Revenue for all selected Customers.
Here is the calculation for the actual Difference …
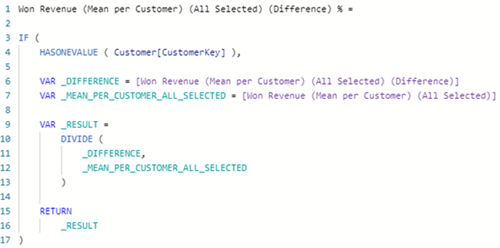
Here is the calculation for the percentage Difference …
The use of HASONEVALUE() in each of these two calculations prevents the calculation from being performed for any rows that include multiple Customers. In this example, that is the Total row in the matrix. It would not be meaningful for those values to be calculated at the Total level. You can consider using HASONEFILTER(), HASONEVALUE() or ISINSCOPE() to achieve this, as explained in this article: https://www.sqlbi.com/articles/distinguishing-hasonevalue-from-isinscope.
The results of these two final calculations are displayed in the last two columns of the matrix in this image.
Conclusion
In conclusion, the ability to calculate the Mean for a set of values such as the Mean of Won Revenue for Customers or the Mean of Won Revenue for Opportunities is a meaningful value to calculate and display on visualisation such as data cards.
However, it is more meaningful if being displayed in a matrix where the results are segmented, for instance by Customer, to use the calculation of the Mean as a step toward then calculating and displaying other values such as actual difference and the percentage difference between the Won Revenue for a Customer and the Mean of Won Revenue for all selected Customers.
This article has provided a step-by-step demonstration of how to calculate such values. The patterns demonstrated in this article can be adapted for your own use.


