

Power BI: Is On Or Before Highest Transaction Date Pattern
Colin Maitland, 05 April 2022
In this article, I demonstrate using a DAX pattern named ‘Is On Or Before Highest Transaction Date’. This pattern may be used to prevent values from being calculated for dates in report that are higher than the highest date of the transactions being reported on. This pattern prevents your report from including such dates from the report. This pattern can be used for both Calendar and Fiscal reporting periods when writing Date/Time Intelligence ‘Measures’ and ‘Calculation Items’ in Power BI.
I use this pattern when for, example I want to calculate the Cumulative Actual Revenue for Closed Won Opportunities and display the results by Fiscal Quarter up to but not beyond the highest Fiscal Quarter for which there are Closed Won Opportunities. For example, assuming the highest Actual Close Date for Won Opportunities falls within FQ1 FY22, then I want to calculate and display the Cumulative Actual Revenue for Closed Won Opportunities up to but not beyond the end of that Fiscal Quarter.
In this article I am demonstrating this pattern using Opportunities and a measure named ‘Actual Revenue (ATD)’. ATD means ‘All to Date’, i.e., all dates on or before the highest date’. While I am reporting on Opportunities, the transactions you might be reporting on can be any of type such as these common examples: Activities, Cases, Leads, Memberships, Opportunities, Orders, Payments, Quotes, Subscriptions and Registrations .
The following images show the results for the Actual Revenue (ATD) calculation with and without using the DAX ‘Is On Or Before Highest Transaction Date’ pattern. In these images, Actual Revenue (ATD) - Example 1 does not use this pattern, and Actual Revenue (ATD) - Example 2 uses this pattern.
You will notice that Actual Revenue (ATD) – Example 1 is calculated for every Fiscal Quarter, but Actual Revenue (ATD) – Example 2 is not calculated for the last three Fiscal Quarters. The reason for this is because the highest Actual Close Date for Won Opportunities falls within FQ1 FY22. As a result, there is no additional Actual Revenue for Opportunities for any dates after FQ1 FY22. In Example 1 you will notice that the same cumulative value as that calculated for FQ1 FY22 is calculated for FQ2 - FQ4 in FY22 while for Example 2 the cumulative value is not calculated and so remains blank.
This image shows the calculated values displayed using a table:
 This image shows the calculated values displayed using a matrix with the values displayed as rows:
 This image shows the calculated values displayed using column charts:
 This image shows the calculated values displayed using column charts:

Using the DAX ‘Is On Or Before Highest Transaction Date’ pattern, you can then configure tables, matrixes and charts to only display the Calendar or Fiscal periods for which there are transactions as shown in the following images. In these images, the visualisations have been configured to:
• display the Actual Revenue (ATD) measure that uses the ‘Is On Or Before Highest Transaction Date’ pattern
• not show items for which there is data
You will notice that these visualisations no longer show Fiscal Quarters for dates that are higher than the highest Opportunities Actual Close date.


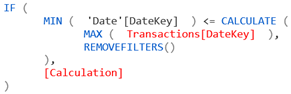
Here is the generic ‘Is On Or Before Highest Transaction Date’ DAX pattern. This pattern assumes that you have a Date dimension table with a one-to-many filtering relationship from the Date table to your transactions table using two DateKey columns such as Date[DateKey] and Transactions[DateKey]. Essentially, this pattern checks if the highest date in the current context is on or before the highest date for all transactions. If this condition is met, then the calculation is performed; otherwise, it is not.

When using this pattern, you need to:
• Replace ‘Date’[DateKey] with the Table Name and Column Name of the DateKey field in your Date table.
• Replace Transactions[DateKey] with the Table Name and Column Name of the relevant DateKey field in your transactions table, such as Opportunities[ActualCloseDateKey].
• Replace [Calculation] with the Date/Time Intelligence measure or the calculation, such as that for Actual Revenue (ATD). If using this pattern in a Calculation Item rather than a Measure, you should replace [Calculation] with SELECTEDMEASURE() and ensure that the Transactions[DateKey] clause is updated in a such as way that it correctly handles the types of transactions that the Calculation Item might be applied to.
Here is an example of the calculation of Actual Revenue (ATD) – Example 1 that does not use this pattern:
 Here is an example of the calculation of Actual Revenue (ATD) – Example 2 that does use this pattern:

In conclusion, this DAX pattern is useful when you want to prevent Date/Time Intelligence values from being calculated and displayed in Power BI reports for dates that occur after the highest transaction date. This pattern can be used for any Calendar and Fiscal Date/Time Intelligence calculations such as MTD (Month-to-Date), QTD (Quarter-to-Date), YTD (Year-to-Date), FYTD (Fiscal Year-to-Date), MAT (Moving Annual Total), and SPLY (Same Period Last Year) etc. The pattern requires the existence of a one-to-many relationship from your Date table to your transaction table using DateKey columns.
Category List

Filter by Author
Adam Murchison
Alfwyn Jordan
Arthur Mandisodza
Calum Jacobs
Colin Maitland
David Mochrie
Dominic Liu
Gayan Perera
Harshani Perera
Isaac Stephens
Jaime Smith
Jared Johnson
John Barrencechea
John Eccles
Lauren Withers
Paul Nieuwelaar
Roshan Mehta
Roz Millar
Ryan Blaikie
Ryan Ingram
Sarah Coleman
Sean Roque
Shalane Williams