Using a Calculation Group to configure a Matrix in Power BI
Colin Maitland, 11 August 2021
In this article, I will demonstrate the use of a Calculation Group to dynamically update the columns displayed by a matrix (i.e Pivot Table) visualisation in Power BI.
The following image shows a page from a sample Power BI report. This page provides an analysis of Opportunities Estimated Revenue and Actual Revenue for a selected Date Range.
The Date Range slicer at the top of the page allows the users to select the Date Range. The values displayed by the other visualisations on this page are then filtered by the selected dates. In this example, the selected Date Range is ‘This Fiscal Year’ and so the selected dates are 1/07/2020 to 30/06/2021.
The column chart in the middle of the page displays the Estimated Revenue and Actual Revenue by Fiscal Month for the selected Date Range. If the user selects one of the months on this chart, the values displayed by the other visualisations on this page are then filtered by the selected dates. In the image below, the selected Month is Mar FY’21 and so the selected dates are 1/03/2021 to 31/03/2021.
The most interesting aspect of this report page, however, is the Estimated Revenue and Actual Revenue by Customer matrix at the bottom of the page. This matrix displays three measures: Estimated Revenue, Actual Revenue and Actual Revenue % for the selected dates.
The slicer above this matrix allows the user to select one or more Calculation Items from a Calculation Group named ‘Date/Time Intelligence (Fiscal)’. The configuration of the Visual Interactions for this slicer ensures that it only interacts with the matrix. It is not configured to filter any other visualisations on this page.
In this example, the matrix is configured to display the Estimated Revenue, Actual Revenue and Actual Revenue % for each selected Calculation Item; e.g. Value, QTD, FYTD and TFY.
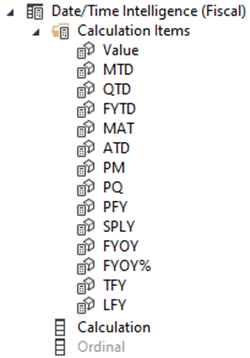
‘Date/Time Intelligence (Fiscal)’ Calculation Group
In general, the Calculation Items in this Calculation Group include items that adjust the measures to which they are applied so that the measures calculate their values for a different set of dates than the selected dates.
The calculations are adjusted so that the selected dates are:
· Value: the same dates are those already in effect when the measure is calculated.
· MTD, QTD and FYTD those for the month, quarter or fiscal year to date in which the highest selected date falls.
· MAT: Moving Annual Total. Those for the last 365 days if not including a leap year, otherwise the last 365 days.
· ATD: All To Date. All dates to on or before the highest selected date.
· PM, PQ and PFY all dates for the previous month, quarter, or fiscal year in which the highest selected date falls.
· SPLY: all dates for the Same Period Last Year as the selected dates.
· TFY and LFY all dates for This Fiscal Year and Last Fiscal Year relative to today’s date.
Calculation Item DAX Formula Examples
Here are the DAX formulas for the four selected Calculation Items selected in the previous image. In the following examples, it is assumed that today’s date is 30/06/2021, the selected Date Range is This Fiscal Year, and the selected Month is Mar FY’21. Therefore, the selected dates are 1/03/2021 to 31/03/2021.
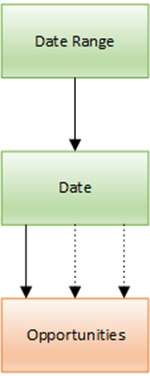
These formulas are based on the following Data Model, where ‘Date Range’ filters ‘Date’ and ‘Date’ filters Opportunities. The arrows in this diagram show the filtering direction of each relationship. The many-to-many relationship from ‘Date Range’ to ‘Date’ is based on ‘Date Range’[DateKey]’ to ‘Date’[DateKey]’. The three one-to-many relationships from Date to Opportunities are based on ‘Date’[DateKey] to Opportunities[CreatedOnDateKey], Opportunities[EstimatedCloseDateKey] and Opportunities[ActualCloseDateKey].
Value
The Value Calculation Item calculates each of the measures without changing the selected dates. SELECTEDMEASURE() is a reference to the measure to which the Calculation Item is currently being applied.
QTD
The QTD Calculation Item calculates the measures after changing the selected dates to 1/01/2021 to 31/03/2021 by removing the filters on Date Range using REMOVEFILTERS() and replacing the filters on Date using the DATESQTD() date/time intelligence function.
FYTD
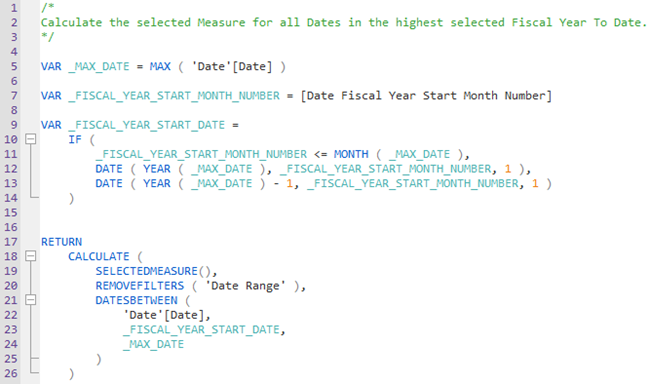
The FYTD Calculation Item calculates the measures after changing the selected dates to 1/07/2020 to 31/03/2021 by removing the filters on Date Range using REMOVEFILTERS() and replacing the filters on Date using the DATESBETWEEN() date/time intelligence function.
TFY
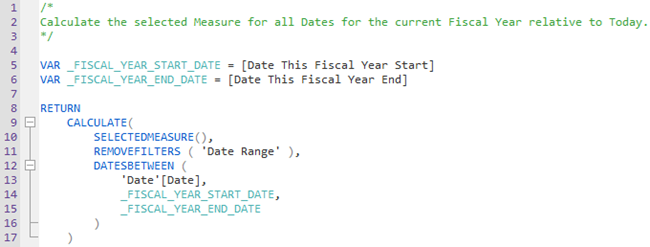
The TFY Calculation Item calculates the measures after changing the selected dates to 1/07/2020 to 30/06/2021 by removing the filters on Date Range using REMOVEFILTERS() and replacing the filters on Date using the DATESBETWEEN() date/time intelligence function.
In this example, if the selected Date Range is This Fiscal Year, and there is no selected Month in the ‘Estimated Revenue and Actual Revenue by Fiscal Month/Year’ chart, the Value, FYTD and TFY columns for Estimated Revenue, Actual Revenue, and Actual Revenue % would display the same set of values, because they would apply to the same set of Dates.
Date/Time Intelligence (Fiscal) Slicer
Using the slicer, the user can change which Date/Time Intelligence (Fiscal) Calculation Items are displayed as columns in the matrix.
Here, Estimated Revenue, Actual Revenue and Actual Revenue % for the Value Calculation Item are displayed.
Here, Estimated Revenue, Actual Revenue and Actual Revenue for the Value and QTD Calculation Items are displayed.
Here, Estimated Revenue, Actual Revenue and Actual Revenue % for the Value, QTD and FYTD Calculation Items are displayed.
Here, Estimated Revenue, Actual Revenue and Actual Revenue % for the Value, QTD, FYTD and TFY Calculation Items are displayed.
The user can select any combination of Calculation Items for the display of Estimated Revenue, Actual Revenue and Actual Revenue %.
Matrix Configuration
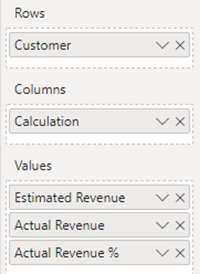
The configuration of the matrix is shown below. The Customer is from the Customer table, the Calculation is the renamed Name field from the ‘Date/Time Intelligence (Fiscal)’ Calculation Group, and the Estimated Revenue, Actual Revenue and Actual Revenue % are measures from the Opportunities table. The values of Calculation are the names of the selected Calculation Items such as Value, QTD, FYTD and TFY.
Conclusion
When using Calculation Groups, it is easy to configure visualisations so that they display variations of the calculations performed by one or more measures. It is also easy to configure and use Slicers for Calculation Groups that allow users to dynamically select which variations of the measures displayed by any visualisations with which the Slicer interacts are displayed.
In this article I have demonstrated the use of the Calculation Items from a Calculation Group named ‘Date/Time Intelligence (Fiscal)’ to dynamically display variations of measures for Estimated Revenue, Actual Revenue and Actual Revenue % in a matrix. Calculation Items can be used to filter visualisations using Slicers, Visualisation Filters, Page Filters and Report Filters.
The use of Calculation Groups on slicers to allow users to select which Calculation Items are displayed by visualisations that they filter provides an easy to configure dynamic and powerful user experience.
The use of Calculation Groups also reduces the number of variations of measures that need to be added to a data model. In this article, I have referred to one Calculation Group with 14 Calculation Items and to 3 Measures. Without the use of this Calculation Group, 42 measures would need to be added to data model if all 14 of these variations for each of these 3 measures needed to be used.
Finally, Calculation Groups and their associated Calculation Items cannot be added or edited using Power BI Desktop. However, they can be by using Tabular Editor. You can download the free version of Tabular Editor from here and the paid version from here.


