Dynamically setting the Y-Axis on multiple Charts in Power BI
Colin Maitland, 27 June 2021
In this article, I will demonstrate how to dynamically align the end value for the Y axis between two corresponding charts in Power BI. This demonstration will use of the example of displaying Won sales versus Lost Sales by Fiscal Quarter.
A common approach to comparing values, such as Won Sales versus Lost Sales, is to combine them into a single clustered column chart as shown in the following image. The visual scale of the Y-axis for Won Sales versus Lost Sales is the same because they are displayed against the same Y-axis.
Sometimes, there is a requirement for the values being compared to be displayed on separate charts. In this example, you will notice that the End Value for the Y-axis for these two charts are not aligned with each other. Therefore, the visual scale of Won Sales versus Lost Sales is not the same. In this example, the visual scale difference is almost 50%. This difference in scale does not provide an accurate visual comparison between the two sets of values.
What would be desirable would be to have the End Value for the Y-axis on both charts be dynamically configured to be the maximum value of either Won Sales or Lost Sales.
A simple solution is to use two stacked-column charts that both display Won Sales and Lost Sales. Using this approach, on the Won Sales chart, the Lost Sales will be hidden; and on the Lost Sales chart, the Won Sales will be hidden. This is accomplished by,
· changing the Data Colour and the Data Label colour of the series that is to be hidden to the same colour as the Background Colour of the chart.
· turning off the Legend so that it does not appear that the chart displays more than one series
· setting the Start Value for the Y-axis on both charts to 0.
This example shows each chart before the components that are not to be displayed is hidden.
This example shows each chart after the components that are not to be displayed are hidden.
You will, notice that the End Value for the Y-axis is now the same on both charts, and therefore the visual comparison of Won Sales versus Lost Sales is now the same.
However, this approach has a side-effect! There can be wasted space on the Y-axis of each chart. This is especially evident when the difference between the Won Sales and Lost Sales for any column on the chart is 50%. In that case, half of the Y-axis on each chart would be unused space and the columns on the chart would be shorter than they could be.
This side-effect is solved by instead of including hidden Lost Sales on the Won Sales chart and hidden Won Sales on the Lost Sales chart …
(a) include a hidden ‘Won Sales minus the maximum of Won Sales or Lost Sales’ on the Won Sales chart.
and
(b) include a hidden ‘Lost Sales minus the maximum of Lost Sales versus Won Sales’ on the Lost Sales chart.
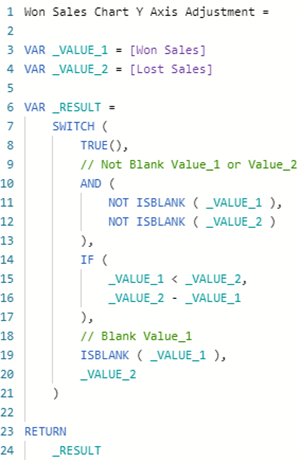
Here is a formula for (a) a measure to be displayed instead of Lost Sales as a hidden value on the Won Sales chart.
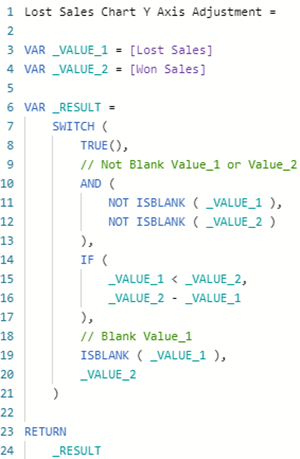
Here is a formula for (b) a measure to be displayed instead of Won Sales as a hidden value on the Lost Sales chart.
These formulas only differ from each other on lines 3 and 4. These measures should be added to the Report rather than to the Data Model in Power BI, assuming that the Data Model and Report are separate Power BI files. This is because their use is specific only to certain charts in the Report.
This image shows the updated charts before hiding the Legend and the Y-Axis Adjustment values.
This image shows the updated charts after hiding the Legend and the Y-Axis Adjustment values.
You will not notice that the End Value for the Y-axis on both charts is now dynamically set to the same value. Therefore, the visual scale of the two charts are the same without any wasted space on the Y-axis. The End Value for the Y-axis on both charts is now only the maximum of either Won Sales or Lost Sales, rather than the maximum of Won Sales plus Lost Sales.


