How to Sort Multiple Sets of Age Groups in Power BI
Colin Maitland, 22 May 2019
In this article, I will describe how to configure sorting for an Age Group dimension in Power BI that has multiple sets of Age Groups for the same age ranges. The example discussed in this article is based on aggregating Referrals stored in Dynamics 365 by Age Group.
The Power BI Data Model has an Age Group dimension and a Referrals fact table. These are related to each other by an ‘AgeGroupKey’. The Referrals table also has a Measure named ‘Referrals (Count)’ for counting the number of distinct Referrals.
The Age Group dimension is configured as shown in the image below.
You will notice that there is one set of non-overlapping contiguous age ranges defined in the Age Group table; refer to the Minimum Age and Maximum Age columns.
You will also notice that each of these age ranges is associated with four sets of Age Groups; i.e. Age Group 1 to Age Group 4. These are aligned with the business requirements for a specific set of customer-defined reports.
By default, any visualisation added to a report for a specific Age Group set will be sorted by the name of the Age Groups. However, the results are not what is desired because some of the Age Groups are displayed in the wrong order. Only the Age Groups for Age Group 2 are sorted in a desirable manner.
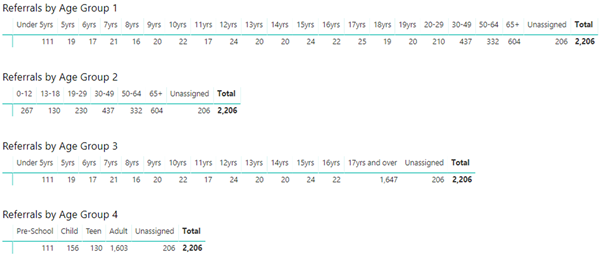
The results are shown in the following images of a matrix on a Power BI report. The same ordering would result if these were displayed using a chart rather than using a matrix.
The first approach to solving this problem is simply to change the Sort By Column for Age Group 1 to Age Group 4 so that they are sorted by either the AgeGroupKey or the Minimum Age as shown in the images below for the configuration of the Age Group 1 column.
This was achieved by navigating to either the Visualisations or the Data area in Power BI Desktop, selecting the Age Group 1 column in the Age Group table, and then clicking the Sort by Column button on the Modelling tab to configure the Sort By Column for Age Group 1.
This works pretty well with the small side effect that ‘Unassigned’ appears at the start of the list rather than at the end of the list. This is because the AgeGroupKey for ‘Unassigned’ is -1.
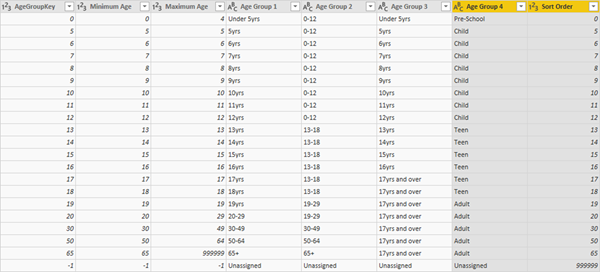
This side effect can be fixed by adjusting the Data Model to either use an AgeGroupKey for ‘Unassigned’ that sorts higher than any of the other AgeGroupKey values or by adding a Sort Order column to the Age Group table and then using that as the Sort By Column for the Age Group 1 column. The following image shows the use of a Sort Order column.
The matrix for ‘Referrals by Age Group 1’ is now sorted in the desired way.
With charts, if you have a field that you want to sort by that is not displayed on the chart, you can add that field to the Tooltips for the chart and then select it as the Sort By field. Adding the field to the Tooltips causes it to then be displayed in the list of fields you can select from for sorting the chart.
This same approach works for charts for ‘Referrals by Age Group 3’ and ‘Referrals by Age Group 4’.
This approach, however, cannot be used if the visualisation is a table or matrix. These can only be sorted by a column that has been added to the table or matrix.
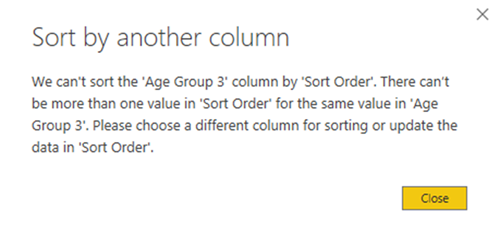
We can, therefore, think about solving this problem by configuring the Sort By Column for the Age Group 3 and Age Group 4 columns in the Age Group table to also be sorted by the Sort Order column. In practice however, at least for this specific set of Age Groups, this cannot be done. The following error is displayed when attempting to do so:
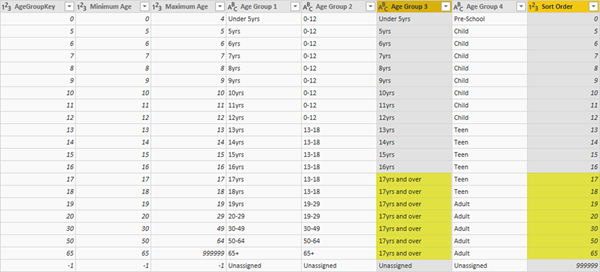
This error occurs because the Sort Order column contains different values for the same corresponding Age Group 3 column values; i.e. the following image shows how there are seven different Sort Order column values for the same Age Group 3 column value of ‘17yrs and over’.
This applies also to the Age Group 4 column where there are different Sort Order values for each of the corresponding Child, Teen, and Adult values.
A possible solution is to change the Sort Order values so that they are the same for each set of corresponding Age Group values. However, the Age Group values for Age Group 1 to Age Group 4 have overlapping boundaries and so this approach is not achievable.
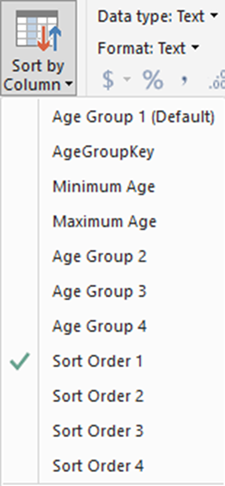
The following image shows a configuration that does work. Four separate Sort Order columns have been added to the Age Group table.
The Age Group 1 to Age Group 4 columns have then been configured so that their Sort By Column is set to the corresponding Sort Order column; e.g. Age Group 1 sorts by Sort Order 1, Ager Group 2 sorts by Sort Order 2 and so on.
The visualisations in the reports, whether charts, tables or matrixes now sort as desired.


