

Power BI Microsoft Dynamics CRM Online – Power View Report Part 1
Colin Maitland, 11 June 2015
In this blog and the next two blogs I will demonstrate how to create a simple Power View report in Microsoft Excel that displays information on Accounts and Opportunities retrieved from a Microsoft Dynamics CRM Online Organisation. This report uses a Power Query named AccountOpportunitiesSet previously created as document in the initial blogs of this series; e.g. refer to Power BI Microsoft Dynamics CRM Online – 18.
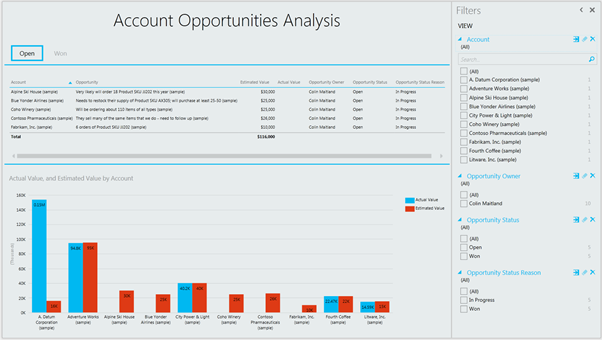
This Power View Report has three main components: a Table and a Chart, that both display Account related Opportunities Estimated Value and Actual Value, and a Filters area. The report is filterable by Account, Opportunity Owner, Opportunity Status and Opportunity Status Reason.
In this blog I will describe how to add and format a table to the report, in the next blog I will describe how to add and format a chart to the report and in the third blog I will describe how to add filters to the report.
Complete the following steps to create the Power View Report and add and format the Table to the top of the report:
- Select a blank Worksheet in Microsoft Excel.
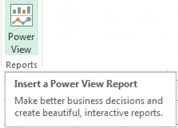
- Click the Power View button on the INSERT tab of the ribbon bar to insert a blank Power View Report onto the selected worksheet.
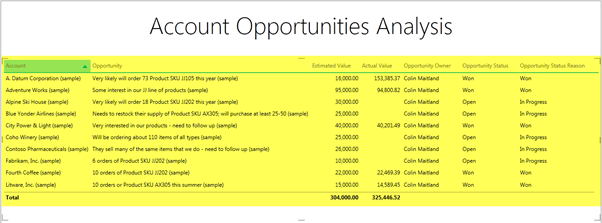
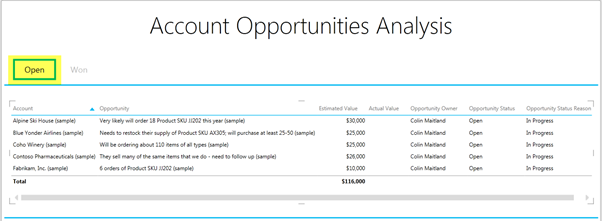
- Edit the Title and enter a name that suits your preferences such as Account Opportunities Analysis:

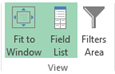
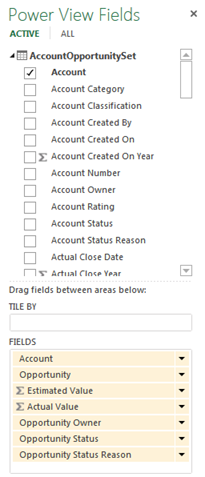
- If required, click the Field List button on the POWERVIEW tab of the ribbon bar to display the Power View Fields pane.
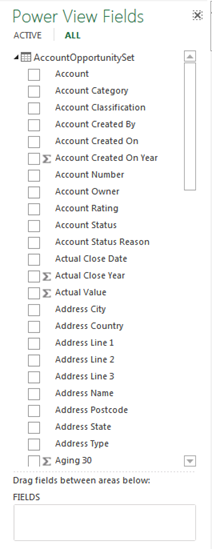
- From the Power View Fields pane drag-and-drop the following fields, or their equivalents, into the FIELDS area: Account, Opportunity, Estimated Value, Actual Value, Opportunity Owner, Opportunity Status and Opportunity Status Reason:
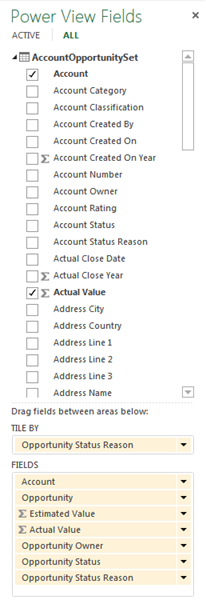
- From the Power View Fields pane drag-and-drop the Opportunity Status Reason, or equivalent field, into the TITLE BY area.
- Select the Table and use the Themes controls on the POWERVIEW tab of the ribbon bar to format the table to suit your preferences.
- If desired, select the Table and use the Increase Font and Decrease Font buttons on the DESIGN tab of the ribbon bar to resize the font for this area to suit your preferences.

- If desired, select, resize and reposition the Table and select and resize the Table Columns to suit your preferences. You can also reorder the Table Columns by changing the order of the fields in the FIELDS area of the Power View Fields pane.
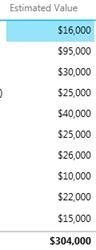
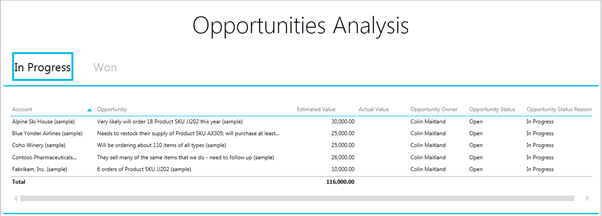
- Select the first value in the Estimated Value column of the table and change the format to Currency with 0 Decimal Places using the Number Controls on the DESIGN tab of the ribbon bar:
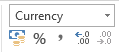
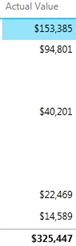
- Select the first value in the Actual Value column of the table and change the format to Currency with 0 Decimal Places using the Number Controls on the DESIGN tab of the ribbon bar:
- Optionally, from the Power View Fields pane drag-and-drop the Opportunity Status Reason, or equivalent field, into the TITLE BY area:
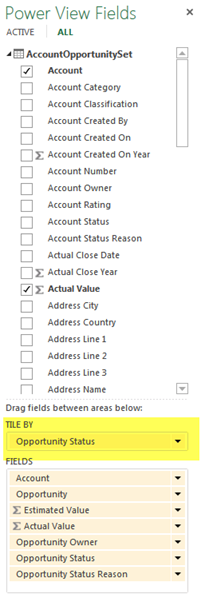
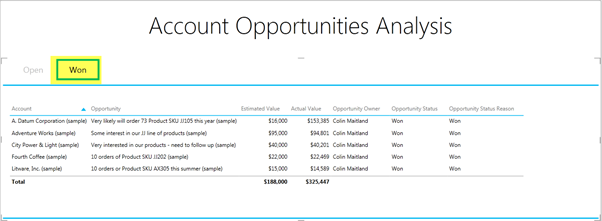
- This results in the table being segmented by the Opportunity Status Reasons. Each Opportunity Status Reason is displayed as a Title above the Table; e.g. Open and Won. Selecting a Title results in the Table displaying the Opportunities that match the selected Title.
- If desired, select, resize and reposition the various components, such as the Title, Title By area Table and Table Columns to suit your preferences.
In my next blog I will demonstrate how to add and format a chart to this Power View Report.
Category List

Filter by Author
Adam Murchison
Alfwyn Jordan
Arthur Mandisodza
Calum Jacobs
Colin Maitland
David Mochrie
Dominic Liu
Gayan Perera
Harshani Perera
Isaac Stephens
Jaime Smith
Jared Johnson
John Barrencechea
John Eccles
Lauren Withers
Paul Nieuwelaar
Roshan Mehta
Roz Millar
Ryan Blaikie
Ryan Ingram
Sarah Coleman
Sean Roque
Shalane Williams