

Tracing and Logging Plugins in Dynamics CRM 2015 Online
Ahmed Anwar, 04 June 2015
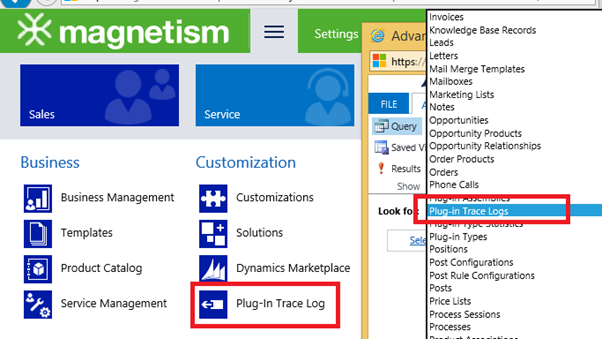
Microsoft Dynamics CRM 2015 Update 1 has introduced a new feature for developers to troubleshoot plugins more efficiently when using ITracingService. This feature allows developers to record tracing information from the Trace() method invoked from Plugins or custom Workflows. The recorded information is stored in a new system entity called Plug-in Trace Logs which you can get to from the Settings area or Advanced Find.
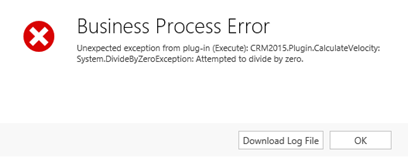
The use of Plugin-Trace Logs makes it easier to troubleshoot issues with plugins and custom workflows. In the past, you would need to rely on users to click on Download Log File whenever they encountered a Business Process Error. However, users often forget to include the log file when reporting errors, so time is wasted communicating with the user to find out what's going wrong. Now you can simply examine the plug-in trace logs to find out what the issue is without needing to request any log files.
By default logging is disabled and you'll need to enable this feature globally in your organisation by navigating to Settings > Administration > System Settings and click Customization tab. 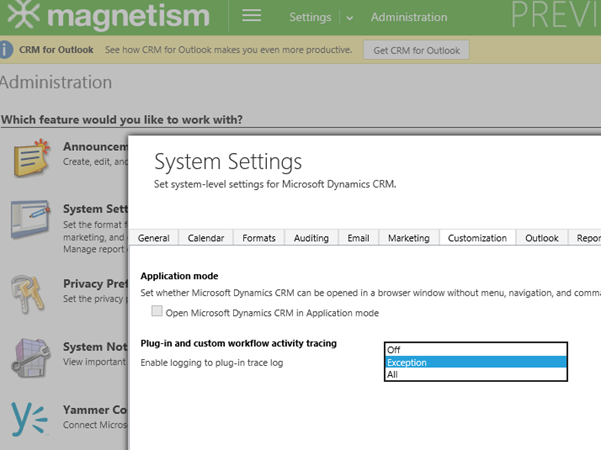
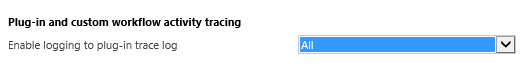
There is a new setting to Enable logging to plug-in trace log which has three options – Off, Exception, and All.
Select Exception if you want to trace any thrown or unhandled plug-in exceptions. This means that any time an unhandled exception occurs in your plug-in, CRM will record the exception trace on your behalf.
Alternatively, select All if you want to log all tracing statements including exceptions.
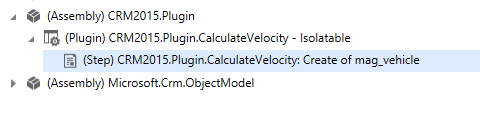
To examine the plug-in trace functionality, I have written a plugin which performs a calculation by dividing one field by another when a record is saved. I have purposely not checked for any divide by zero errors. If we enter non-zero values into both fields, the plug-in will complete the calculation without any errors.
I registered the plugin on Create Message as synchronous and changed the plug-in trace logging level to All.
You will notice that a Plug-in Trace Log record was created even though the plug-in did not fail. This is because we set the Enable logging to plug-in trace log in System Settings to All.
This read-only form shows valuable information about many things that might help developers to address problems. For example, the Depth and Execution Duration etc.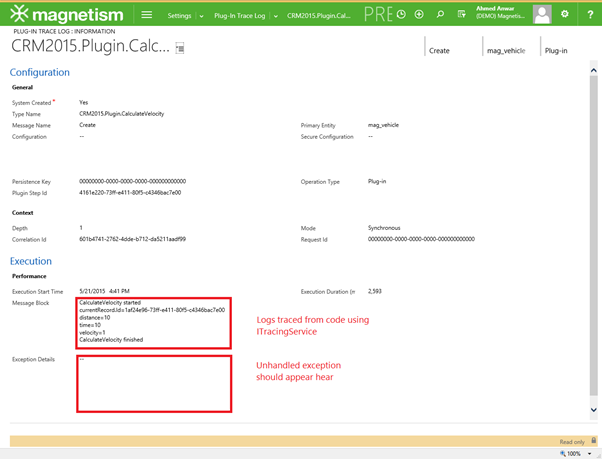
Since the plugin finished execution without errors, the Exception Details is empty.
Now if we set up the data to force a divide by zero exception, we'll see the error bubble up to the user interface. 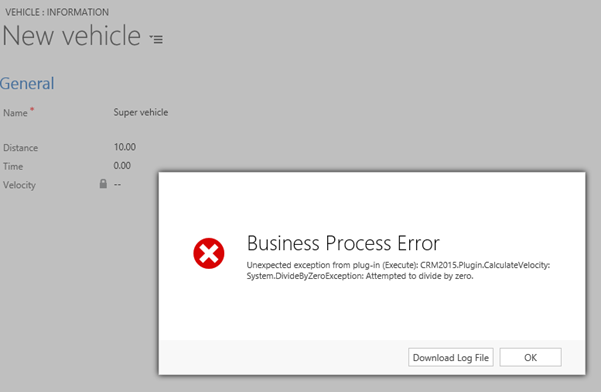
We don't need to click on Download Log File to view the details of the error – the Plug-in Trace Log tells us everything we need to know.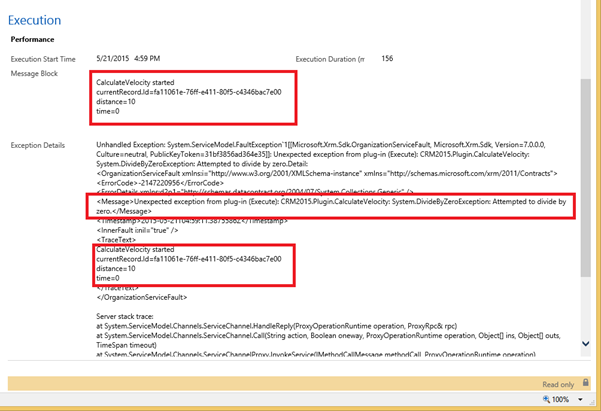
The Message Block field contains the tracing information.
The Exception Details field contains the error details and the Tracing information as well.
Keep in mind that these log records get deleted every 24 hours by a Bulk Deletion Job but you can disable or modify it to meet your needs.
In a future blog post, I'll demonstrate how tracing can be also beneficial when writing plugins running in a Transactional scope.
Category List
Filter by Author
Adam Murchison
Alfwyn Jordan
Arthur Mandisodza
Calum Jacobs
Colin Maitland
David Mochrie
Dominic Liu
Gayan Perera
Harshani Perera
Isaac Stephens
Jaime Smith
Jared Johnson
John Barrencechea
John Eccles
Lauren Withers
Paul Nieuwelaar
Roshan Mehta
Roz Millar
Ryan Blaikie
Ryan Ingram
Sarah Coleman
Sean Roque
Shalane Williams