How to Create a Dashboard in Dynamics CRM 4.0
Simon Phillips, 06 July 2010
In my past blogs I explained how to create a custom report that is more visually pleasing and then add it to CRM as a dashboard. I would now like to take this a bit further to explain some more changes we can make to the report, how to filter the data before we place it onto a chart and some other cool little things that I have come across while playing around in creating reports.
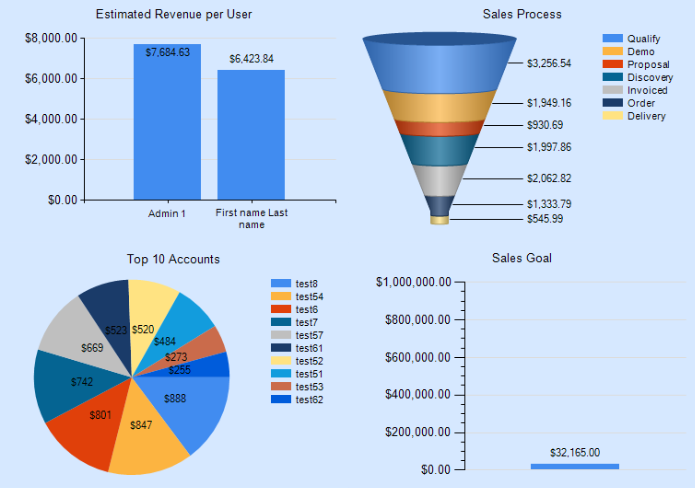
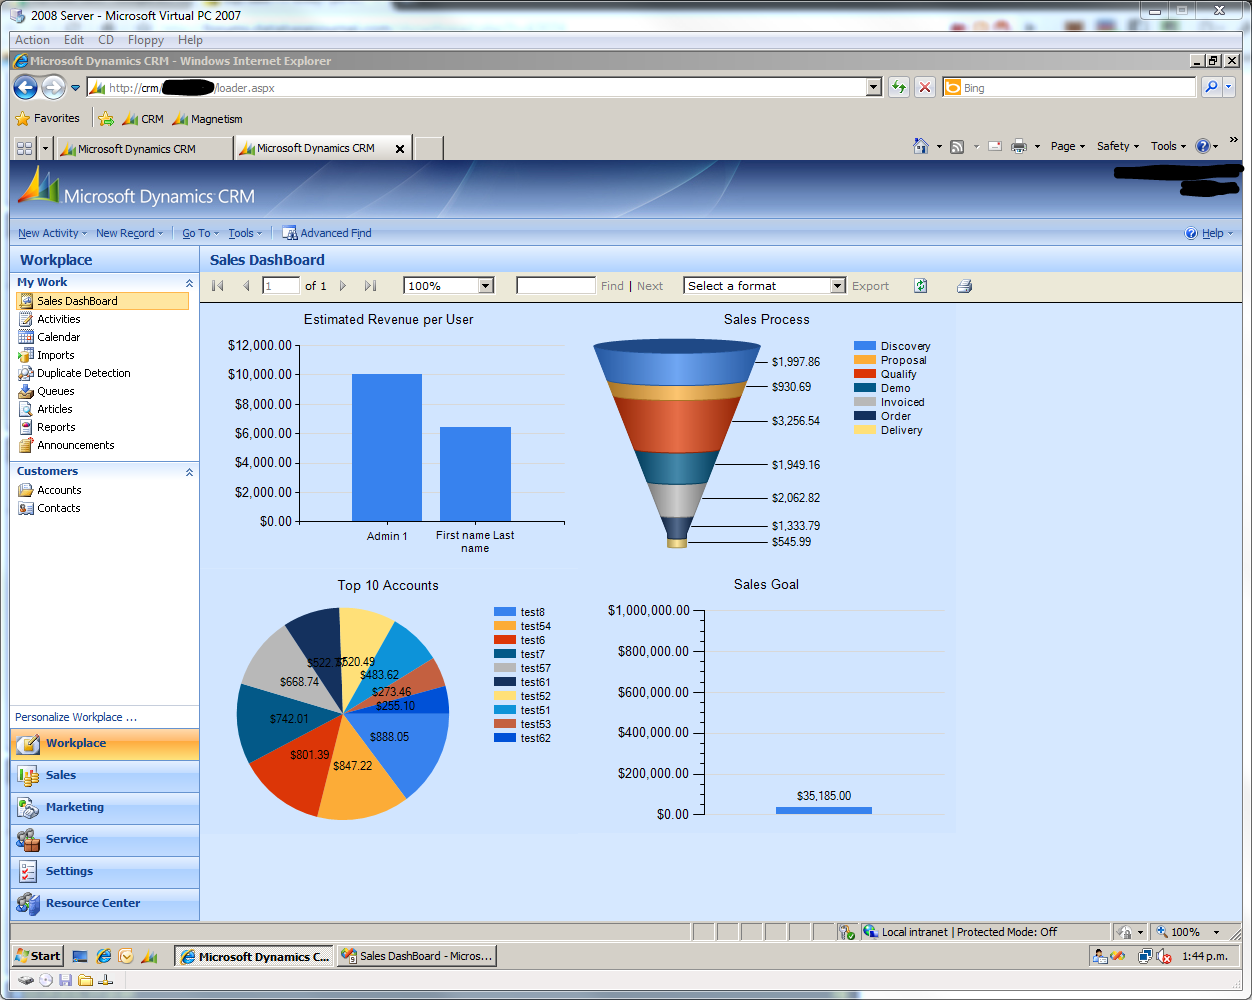
For this blog I will go over how I made a sales dashboard from a base CRM. On this dashboard there are four charts; bar, funnel, pie, and 3D cylinder from three different entities; Accounts, Opportunities, and Invoices. This it is not quite as simplistic as my previous blog about reports but even still it is not overly difficult. In these charts I will apply different filters so that the reports display the information I require for my dashboard.
The four charts I will explain are:
- Estimated Revenue per User (Account)
- Sales Process (Opportunity)
- Top 10 Accounts (Accounts)
- Sales goal (Invoices).
1. ‘Estimated Revenue per User’
This is a bar chart that is very similar to the chart that I explained in my previous blog about reports. The exception for this chart is that I want to filter the data to display only active accounts.
SELECT revenue, owneridname, statuscodename
FROM FilteredAccount
WHERE (statuscodename = N'Active')
2. ‘Sales Process’
This is the funnel chart. In this chart I only want the record that is assigned to the current user and with the record status as ‘in progress’.
SELECT estimatedvalue, name, salesstagecodename, owneridname, statuscodename
FROM FilteredOpportunity
WHERE (ownerid = dbo.fn_FindUserGuid()) AND (statuscodename = N'In Progress')
3. ‘Top 10 Accounts’
This is the pie chart. For this chart I want only records of the current owner. I also want to filter the accounts by the top 10 and in descending order.
SELECT TOP (10) revenue, owneridname, name, statuscodename
FROM FilteredAccount
WHERE (ownerid = dbo.fn_FindUserGuid()) AND (statuscodename = N'Active')
ORDER BY revenue DESC
4. ‘Sales goal’
This is the 3D cylinder. For this chart I want only records that are assigned to the current owner with the status of ‘new’.
SELECT owneridname, totalamount, statuscodename
FROM FilteredInvoice
WHERE (ownerid = dbo.fn_FindUserGuid()) AND (statuscodename = N'New')
Before I go any further please note that all of these charts are not filtering by any date value. This means that they will keep collating data until the status of the record changes. To fix this you need to apply a date filter, whether it be week, month, year etc.
Once I had all the charts displaying all of the information I required I applied styles to them to make them fit within CRM seamlessly. From there I went ahead and placed it into CRM as a Dashboard.
This is my final result:


